VUB HPC Overview 2025#
2025 marked a year of strong growth and strategic preparation for the SDC team. While significant effort was invested in preparing for the next VSC Tier-1 Sofia , the Tier-2 infrastructure (Hydra and Anansi) continued to expand in usage, users, and services.
GPU demand remained high, driven by increasing AI/ML workloads. Although average load was stable, peak periods led to noticeable queue times, reinforcing the need for continued GPU expansion and Tier-1 migration of heavy workloads.
The launch of the Open OnDemand portal significantly lowered the barrier to entry, with 44% of users leveraging interactive services. Outreach and targeted trainings contributed to broadening adoption across faculties and departments. Many research groups were visited to show our services and explain what HPC & Pixiu can mean for a researcher.
In parallel, Pixiu storage grew to 1.6 PB in active use and underwent major infrastructure upgrades to improve redundancy and future scalability.
Overall, 2025 positioned VUB strongly for the operational start of Tier-1 Sofia in 2026, with a growing and increasingly mature HPC user community ready to scale to larger systems.
Now that 2025 is behind us, it is time to review statistics on infrastructure usage for the year.
Hydra Highlights of 2025:
3.2 centuries of single-core CPU compute time used
21.4 years of GPU compute time used
A total of 963,894 jobs were run, with the large majority lasting less than 1 hour
About 30% of the jobs were responsible for 99% of the used CPU compute time and 97% of the GPU compute time
There were 562 unique users active on Hydra in 2025
369 new VUB VSC accounts were created in 2025
Usage of Hydra per month#
Most important changes in 2025:
New OnDemand web portal for HPC. This new portal has drastically lowered the barrier to entry to the cluster and allows us to offer new (GUI) programs in a straightforward way.
New GPU nodes for interactive use on Anansi. These nodes have 4x NVIDIA L40S cards which are ideal for interactive usage.
New compute nodes added to Hydra. 24 new compute nodes with 4 nodes having 1.5 TB of RAM memory to replace the old high memory nodes. All these nodes feature a Turin CPU (zen5) with NDR InfiniBand (200 Gbps) network connection.
The cluster was upgraded to a new major operating system release: Rocky Linux 9. The operation was done without downtime.
Last goodbye to the Skylake partition. All Skylake worker nodes were decommissioned. They served the cluster well since 2018.
New command tool to recover lost data. Now it is easier than ever to recover accidentally deleted data.
The notebook platform was shut down to be replaced by our Open OnDemand portal as it offers a superior experience.
We launched a closed pilot phase for the newly purchased GPU nodes with NVIDIA H200 cards (which are in production in the mean time).
Outreach effort: we gave HPC and Pixiu introduction courses to many different research groups during the year.
Users#
There were 599 unique users of VUB HPC clusters in 2025 (i.e. submitted at least one job), compared to 383 in 2024:
513 unique users of the CPU nodes (2024: 363)
208 unique users of the GPU nodes (2024: 130)
37 unique users which only used the interactive cluster Anansi
Employment Type |
Users |
Relative |
|---|---|---|
UZB |
2 |
0.4% |
Guest professor |
7 |
1.2% |
Administrative/technical staff |
12 |
2.1% |
Professor |
14 |
2.5% |
Non-VUB |
46 |
8.2% |
Students |
172 |
30.6% |
Researcher |
309 |
55.0% |
As expected, the majority of users on our clusters are researchers, but this year the ratio of students slightly increased by 5%. It must be noted that the Students category includes only students up to the Master level.
The students are a diverse group yet they all come from the Science or Engineering faculty. The majority of students on VUB HPC are Master students, which is the education level where most training courses happen.
Users |
Relative |
|
|---|---|---|
Bachelor |
5 |
2.9% |
Guest |
35 |
20.3% |
Master |
132 |
76.7% |
A Guest here refers to a student following a course at VUB that is not their main education program (for example a joint program with another university).
Distribution per month showing the busiest periods of the year#
The monthly number of active users is almost consistently higher compared to last year to the point where the maximum of 2024 is close to the minimum of 2025. Especially the last two months of 2025 had a lot of active users. This increase was mainly caused by two factors, teaching courses using the HPC in that period and many other new users that we suspect joined the HPC after our multiple outreach campaigns carried out in prior weeks.
We saw a steep increase in new VSC accounts for VUB in 2025: 369 new accounts were created (compared to 237 on 2024). This is the second year in a row with a steep increase in the number of created accounts.
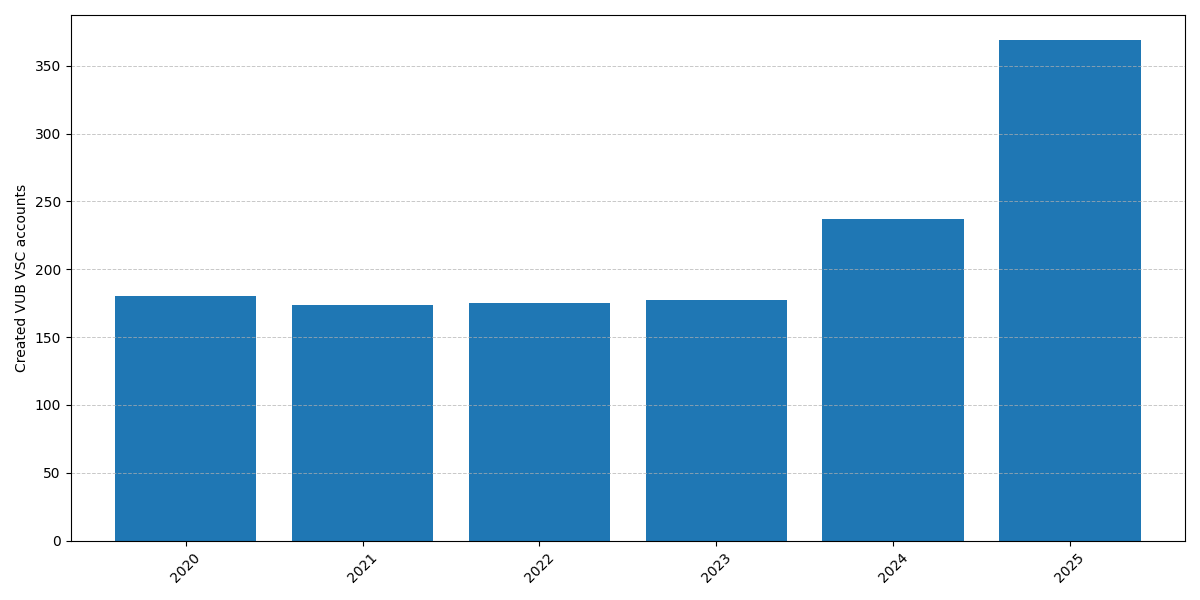
New VSC accounts created per year for VUB#
Our efforts to attract more people to the cluster are paying off. In 2025, we invested significant effort in this through targeted introductions and trainings at the request of specific research groups. If you are also interested in such introductions, or would like to receive custom trainings for your research group, please contact us at VUB-HPC Support.
CPU Usage#
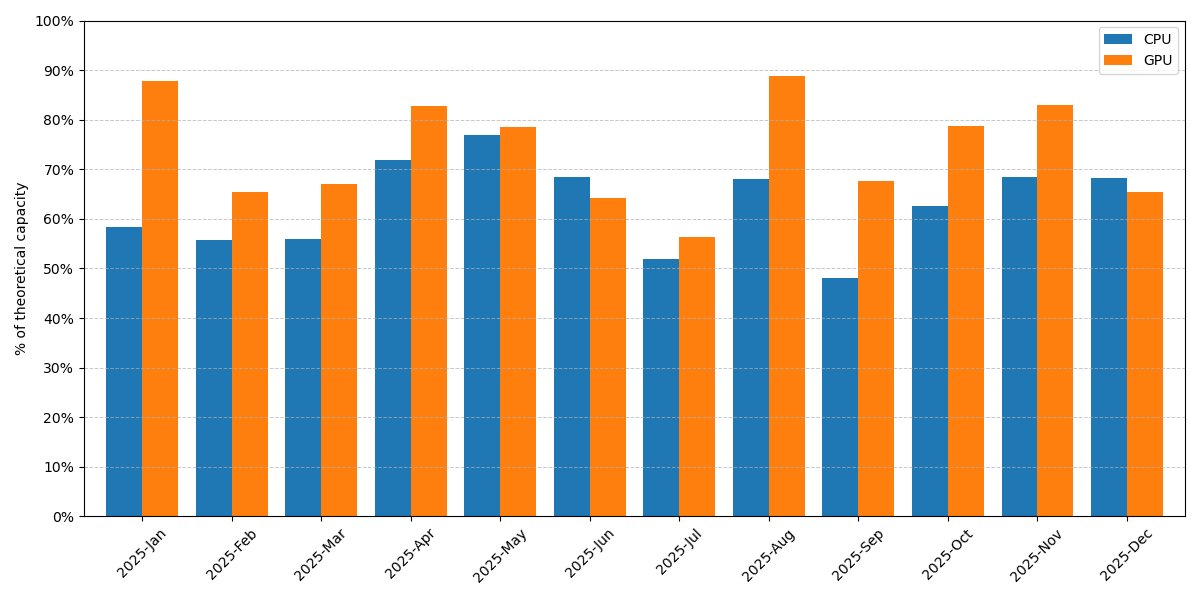
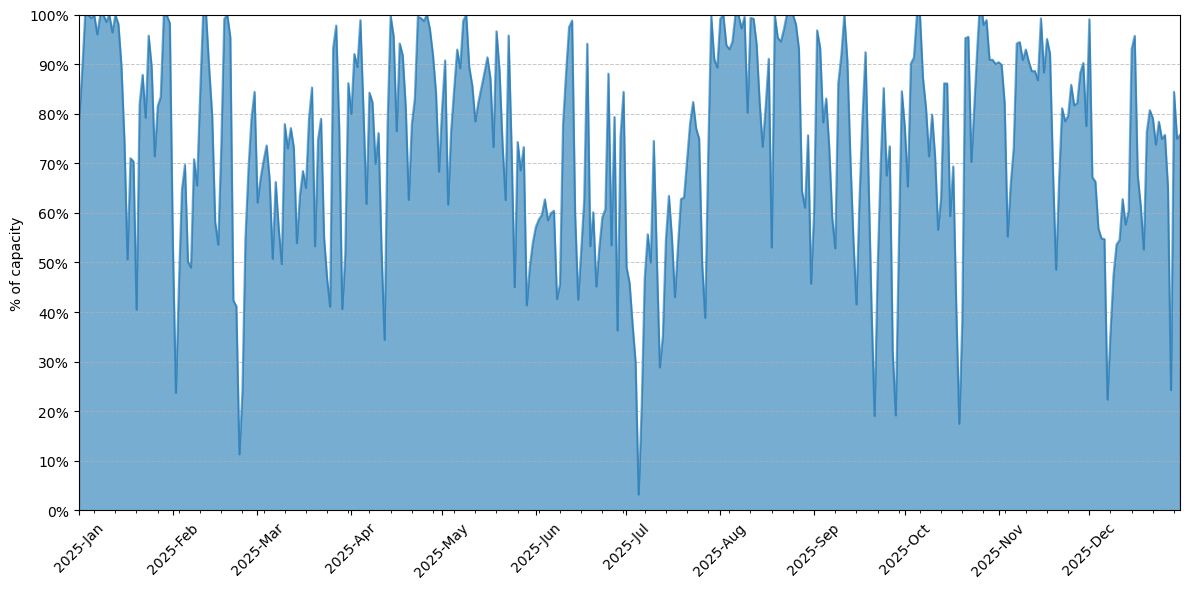
On average, CPU usage on the cluster was 63%, slightly higher than in 2024. The usage pattern matches that of 2024, i.e. large weekly usage fluctuations with higher usage during week days and lower usage in the weekend.
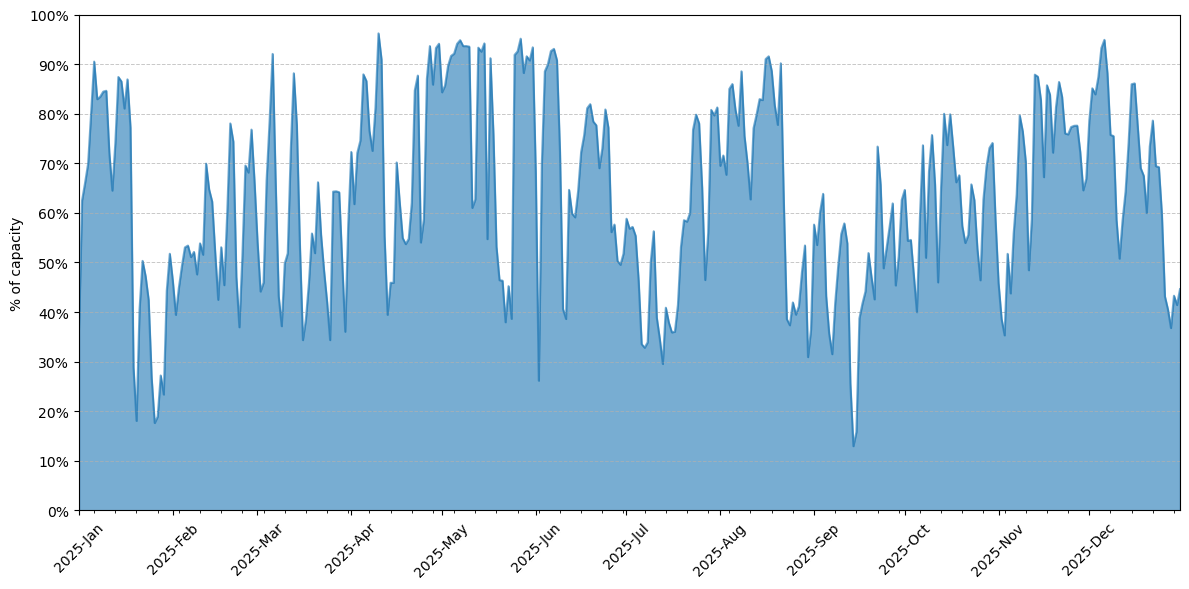
CPU compute time on all partitions of Hydra for 2025. It is shown as a percentage of the theoretical maximum capacity of the cluster.#
As in previous years, the months April and May continue to be busy periods on the cluster but August also stands out, despite being a holiday month.
Tip
Usage during weekends is systematically low, so if you are in a rush to get your jobs started quickly that is the best time to do so.
Usage of VUB HPC clusters is dominated by VUB, which on one hand is expected, but on the other the usage by other VSC sites is almost negligible. This raises a potential point for improvement in the future.
Institute |
Usage |
|---|---|
VUB |
99.1% |
UAntwerpen |
0.0% |
KULeuven |
0.4% |
UGent |
0.4% |
About 80% of CPU compute time is used by just 8% of the users, indicating that a small group dominates the workload on our clusters. This situation is partially explained by the size of Hydra itself. As it is a relatively small cluster with many different smaller partitions, it is not difficult for a few users to use most of its capacity. We also see many users who use the system very infrequently, submitting only a few jobs with long intervals in between. If you are one of those users who only use our clusters infrequently due to difficulties in running your computational jobs, please contact us at VUB-HPC Support and we will help you.
For the remainder of the analysis we only consider jobs which ran for at least 30 minutes as shorter jobs are assumed to be tests or failed jobs. These jobs represent 99% of the used compute time.
Note
A typical CPU job (90% of all jobs) runs on a single node, uses 16 or less cores and ends in less than 20 hours.
Percentile |
Cores |
Nodes |
Walltime |
|---|---|---|---|
0.500 |
1 |
1 |
0 days 04:41:35 |
0.750 |
4 |
1 |
0 days 12:37:48 |
0.800 |
5 |
1 |
0 days 15:04:51 |
0.900 |
16 |
1 |
0 days 20:00:21 |
0.950 |
20 |
1 |
1 days 08:47:06 |
0.990 |
64 |
3 |
3 days 14:04:11 |
0.999 |
210 |
10 |
5 days 00:00:20 |
We see that jobs in 2025 use slightly more cores than the previous year. For instance, the number of cores on the 95th percentile is 20 vs 16 in 2024 and at the 99.9th percentile it increased to 210. In general, the duration of jobs is the same as previous year across all percentiles. The vast majority of jobs complete in less than a day.
If we look at the total used CPU time, split by number of cores used in the job, we see that this matches the percentiles based on number of jobs. Small jobs between 1-16 cores used about 32% of the compute time, while jobs up to 64 cores use about 83% of the compute time. Compared to 2024 we see a shift to larger jobs which follows the increasing amount of cores on a single node.
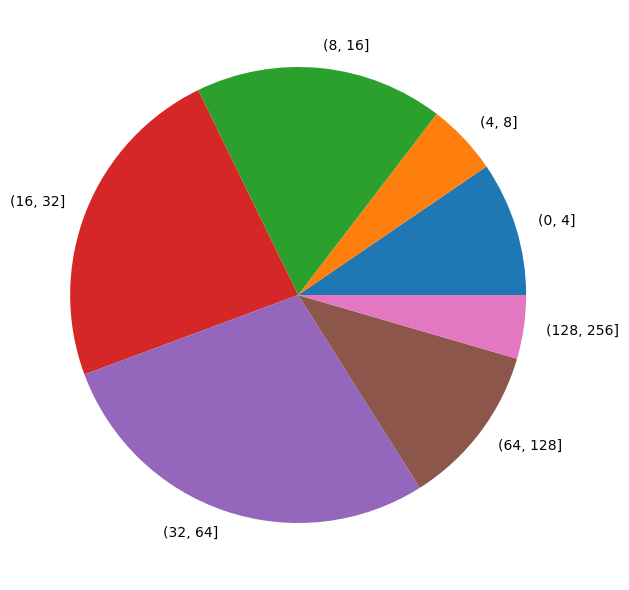
Total CPU time used split by number of CPU cores of the job#
The same analysis on number of nodes shows that the majority of jobs in our clusters are single node jobs. This matches with usage patterns of previous years.
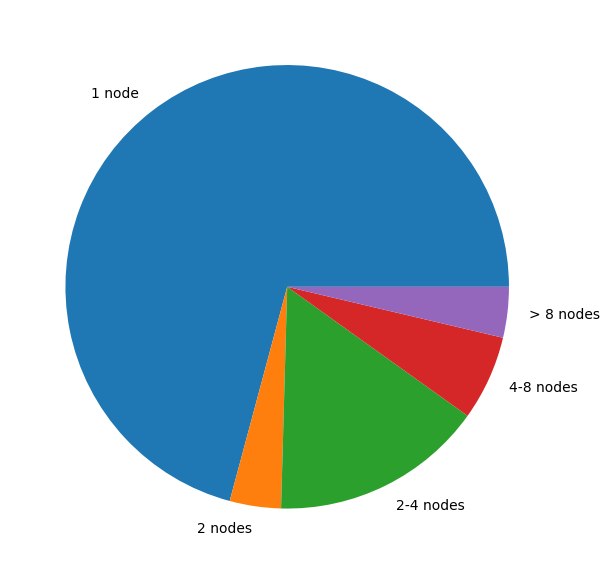
Total CPU time used split by number of nodes used in the job#
In conclusion:
There were many small jobs: 70% of the jobs ran on a single node and almost 60% on 40 or less cores.
There were many short jobs: 90% ran less than 20 hours, 50% even less than 5 hours.
As the load in the cluster was not that high, the queuing time for jobs was short for the large majority of jobs (>90%):
Percentile |
All jobs |
Single core |
Single Node |
Multi Node |
|---|---|---|---|---|
0.50 |
0 days 00:00:33 |
0 days 00:00:33 |
0 days 00:00:33 |
0 days 00:00:24 |
0.75 |
0 days 01:33:46 |
0 days 00:17:24 |
0 days 01:31:14 |
0 days 03:54:02 |
0.80 |
0 days 03:27:59 |
0 days 00:58:08 |
0 days 03:23:51 |
0 days 06:33:10 |
0.90 |
0 days 10:58:48 |
0 days 05:31:54 |
0 days 10:49:53 |
1 days 04:08:07 |
0.95 |
0 days 23:56:04 |
0 days 13:19:33 |
0 days 23:29:48 |
2 days 08:21:43 |
0.99 |
3 days 07:25:19 |
2 days 01:09:16 |
3 days 05:26:05 |
4 days 14:12:43 |
Queuing time depends on the overall load of the cluster and the resources requested by the job. The more resources requested, the higher the queuing time for that job. However, we see that 50% of all jobs start immediately, regardless of the resources requested, and 75% within 1.5 hours. Even for multi node jobs, 80% starts with 6.5 hours.
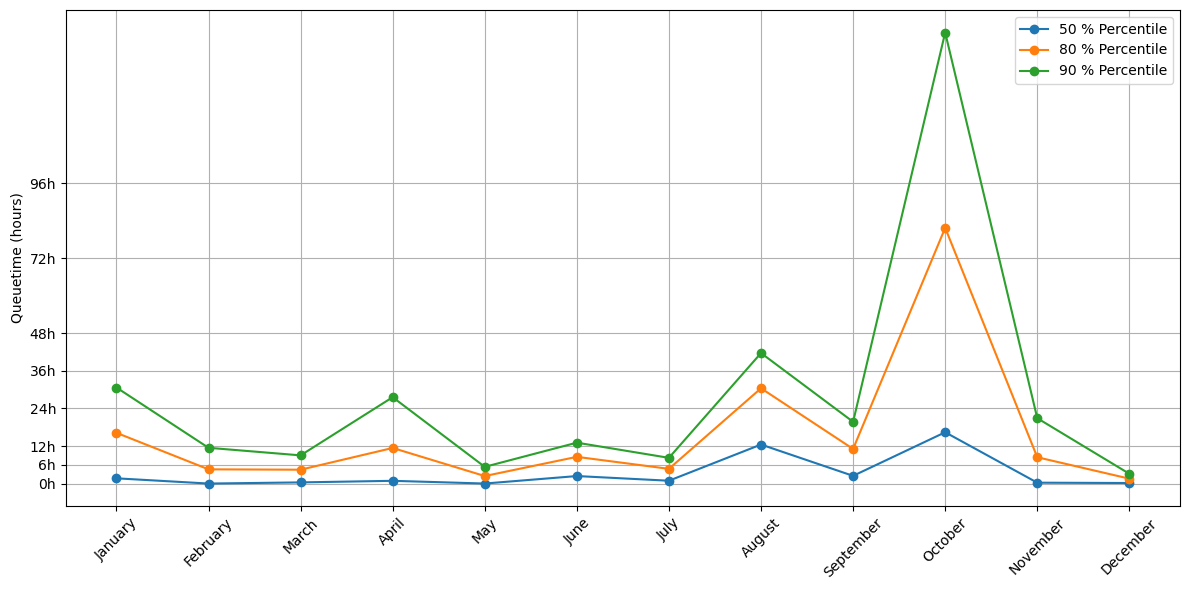
The previous queuing times are averages for the entire year, which flattens out very busy moments when users can experience much longer queuing times. The following graph breaks down queue times by month:
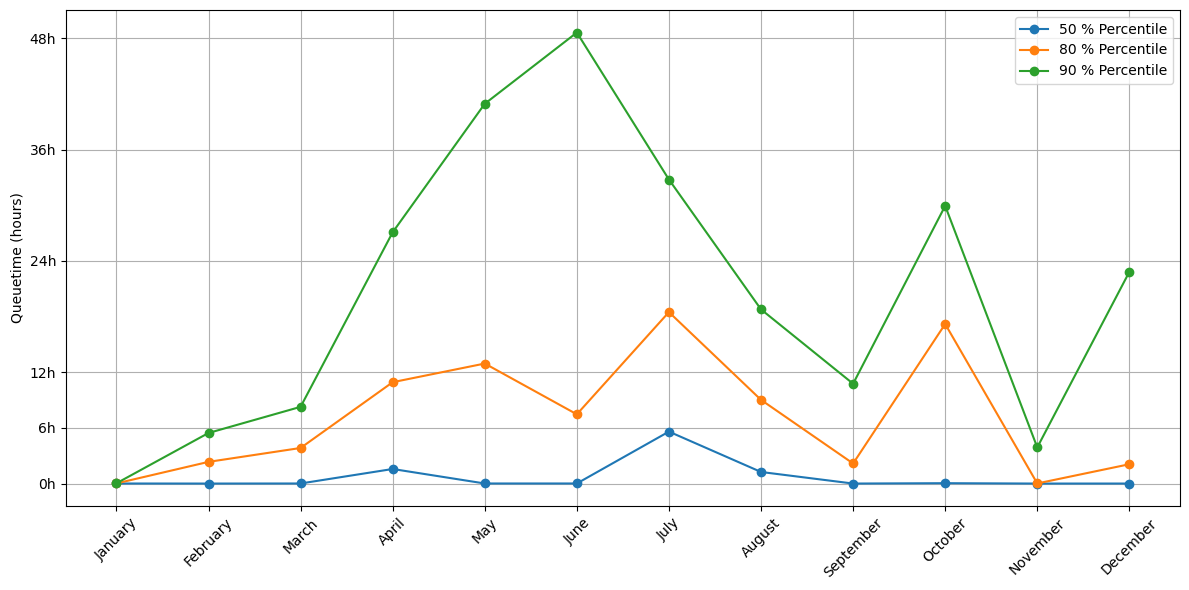
Average queuing time on CPU nodes per month in 2025#
The months of July and October stand out with their higher queuing times. For October this is expected as it is the beginning of the academic year with many new users and trainings. However, the peak of July is not and we do not have any explanation for it beyond a guess that this might be the rush before the summer break. The 90th percentile shows very high peaks because it captures the largest jobs submitted to the cluster.
Due to the large quantity of short jobs submitted to the cluster, we see that the queuing time on Saturday and Sunday is significantly shorter than during the rest of the week. Conversely, Mondays and Tuesdays have the highest queuing times.
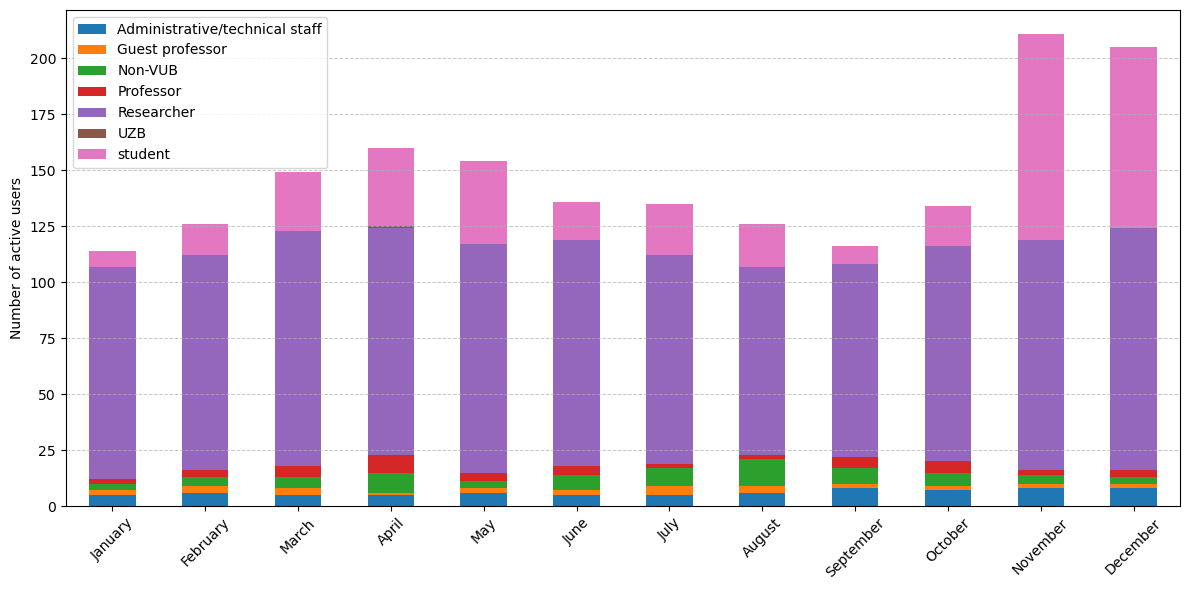
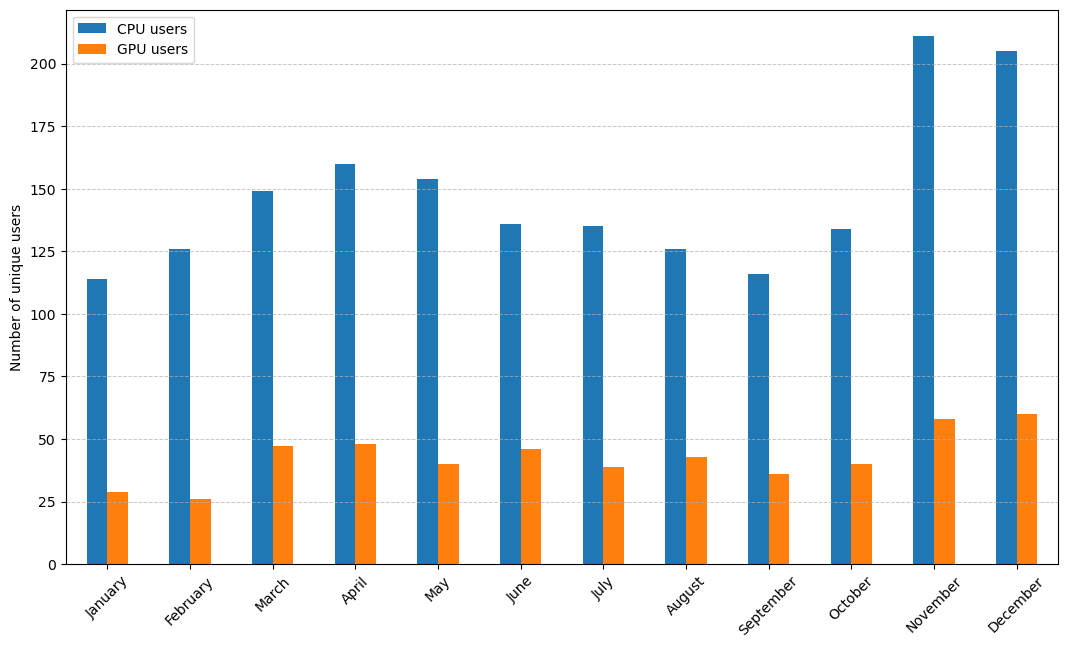
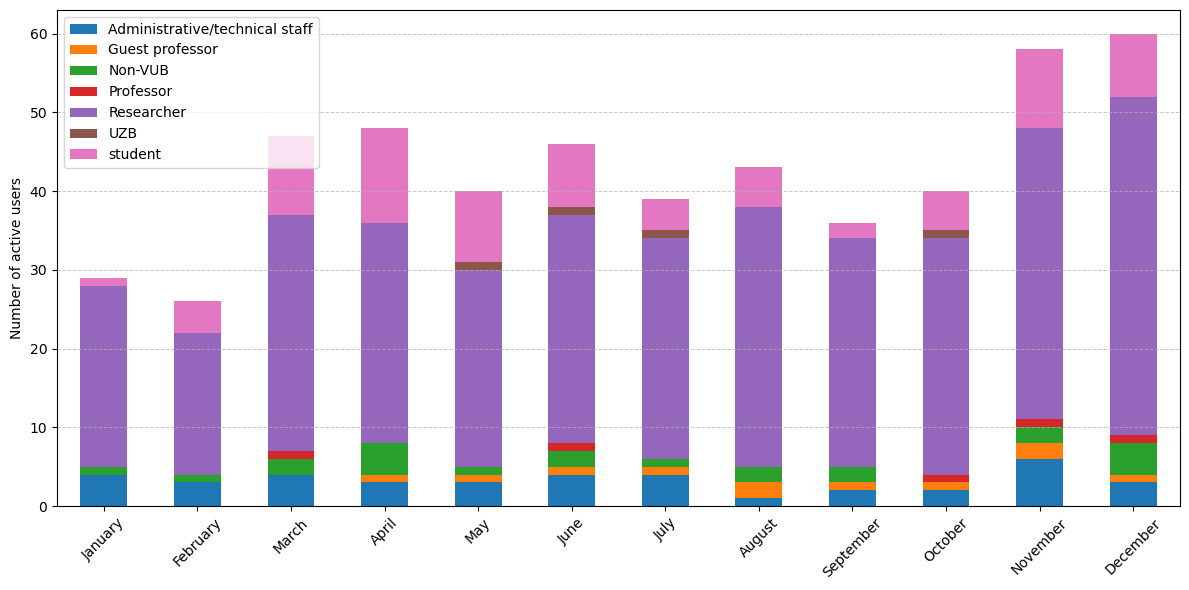
Active users on CPU nodes per month and grouped by type#
If we look at the active users per month, we see no surprises: April and November are the months with most people on the cluster. This year, November was particularly busy because Hydra was used for a training course with a relatively large number of students. If you would also like to use our HPC clusters for teaching, contact us at VUB-HPC Support.
Note
In the following tables, which distribute usage across different entities and user types, you will find two special categories:
Non-VUB are external users from other VSC Sites
Students are students up to the Master level that are not affiliated to any department or research group
Faculty |
Usage |
|---|---|
Faculty of Social Sciences and Solvay Business School |
0.4% |
Non-VUB |
0.9% |
Faculty of Medicine and Pharmacy |
2.1% |
Department ICT |
2.3% |
Students |
13.6% |
Faculty of Engineering |
36.9% |
Faculty of Sciences and Bioengineering Sciences |
43.8% |
We only show faculties that used at least 0.1% of the total compute time of the year. As expected, the Faculties of Sciences and (Bio-)Engineering use the largest share of the CPU compute time. However, compared to 2024 we see that the relative share of the Faculty of Engineering has more than doubled, while that of the Faculty of Sciences has decreased by 20%.
Department |
Usage |
|---|---|
Clinical sciences |
0.2% |
Geography |
0.2% |
Business technology and Operations |
0.4% |
Department of Water and Climate |
0.5% |
Electronics and Informatics |
0.7% |
Department of Bio-engineering Sciences |
0.7% |
Non-VUB |
0.9% |
Basic (bio-) Medical Sciences |
0.9% |
Pharmaceutical and Pharmacological Sciences |
1.0% |
Engineering Technology |
1.7% |
Physics |
1.8% |
Applied Mechanics |
1.9% |
Administrative Information Processing |
2.3% |
Biology |
3.1% |
Applied Physics and Photonics |
3.1% |
Electrical Engineering and Power Electronics |
9.8% |
Informatics and Applied Informatics |
10.1% |
Students |
13.6% |
Materials and Chemistry |
19.0% |
Chemistry |
27.9% |
The overview of used compute time per department reveals the actual use of the cluster per scientific domain. Compared to 2024, the number of departments using a significant portion of the cluster has grown.
We welcome the new departments on the cluster ‘Basic (bio-) Medical Sciences’ and ‘Business technology and Operations’. The ‘Chemistry’ department is still the biggest user but it dropped by 12% compared to 2024. The departments of ‘Materials and Chemistry’ and ‘Electrical Engineering and Power Electronics’ are pushing up and have increased their usage of Hydra the most.
Employment Type |
Usage |
|---|---|
Professor |
0.3% |
Non-VUB |
0.9% |
Administrative/technical staff |
2.3% |
Guest professor |
2.9% |
Students |
13.6% |
Researcher |
80.1% |
GPU Usage#
The load on the clusters GPUs averaged 74%, with some periods of low usage and others where all GPUs were constantly at 100%.
GPU compute time on all partition of Hydra for 2025, shown as a percentage of the theorical maximum capacity of the cluster.#
About 85% of the used GPU time comes from just 10% of the users, similar to what we see on CPUs. On GPUs it is even more exacerbated as those resources are much more scarce and not all users can use a software application with support for GPUs. So it is more probable that a number of power-users can dominate the workload on them.
Institute |
Usage |
|---|---|
VUB |
98.5% |
UAntwerpen |
0.0% |
KULeuven |
1.5% |
UGent |
0.0% |
For the remainder of the analysis we only consider jobs that ran for at least 30 minutes, as shorter jobs are assumed to be tests or failed jobs. The jobs analysed represent 96.9% of the used GPU time.
Note
A typical GPU job (90% of all jobs) uses a single GPU and runs for less than 16 hours.
Percentile |
GPUs |
Nodes |
Walltime |
|---|---|---|---|
0.500 |
1 |
1 |
0 days 01:46:42 |
0.750 |
1 |
1 |
0 days 06:14:59 |
0.800 |
1 |
1 |
0 days 07:57:56 |
0.900 |
1 |
1 |
0 days 15:47:53 |
0.950 |
1 |
1 |
1 days 04:26:29 |
0.990 |
4 |
2 |
3 days 22:14:01 |
0.999 |
6 |
3 |
5 days 00:00:21 |
Looking at the number of GPUs used as function of the used GPU time by those jobs, we see that this matches the previous percentiles based on number of jobs.
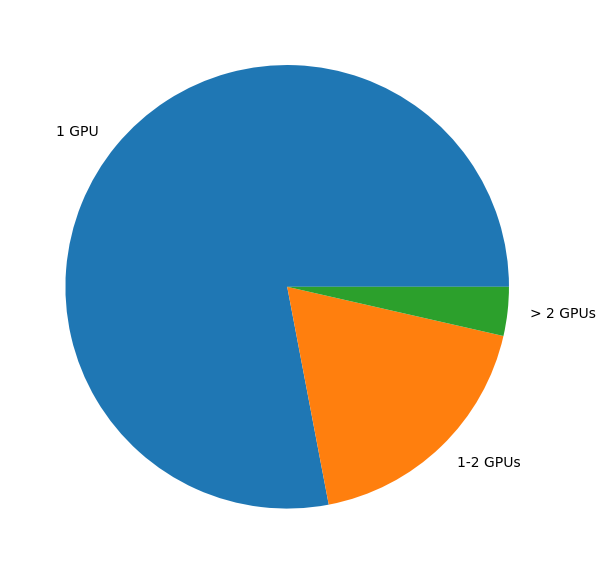
Total GPU compute time used split by number of GPUs in the job#
In conclusion:
The majority of GPU jobs (78%) uses a single GPU
There are many short GPU jobs: 80% of jobs run for less than 8 hours, 50% for less than 2 hours
Compared to 2024, the dominance of single GPU jobs has taken a step back and at the same time the job duration has decreased.
The amount of VSCdocGPU resources in Hydra is a lot smaller than its VSCdocCPU resources, which is reflected by the longer queuing time observed on GPUs. Moreover, we see a general uptake in the use of AI/ML techniques and thus an increasing demand for GPU resources. The latest extension of Hydra is a set of 5 new GPU nodes, each equipped with two NVIDIA H200 GPUs. It is expected that these nodes will become generally available in early 2026.
Percentile |
All jobs |
Single GPU |
Multi GPU |
|---|---|---|---|
0.500 |
0 days 02:35:47 |
0 days 02:37:05 |
0 days 01:57:54 |
0.750 |
0 days 10:52:42 |
0 days 10:42:30 |
0 days 20:41:50 |
0.800 |
0 days 14:31:33 |
0 days 14:18:03 |
2 days 00:19:04 |
0.900 |
1 days 03:24:32 |
1 days 02:08:11 |
5 days 22:06:49 |
0.950 |
1 days 19:42:51 |
1 days 16:45:14 |
9 days 06:02:25 |
0.990 |
5 days 13:16:56 |
4 days 07:01:52 |
11 days 19:20:49 |
0.999 |
10 days 10:32:20 |
8 days 17:57:01 |
12 days 10:57:28 |
The load on the GPU nodes was slightly lower compared to 2024 and the queuing time was also slightly lower (ignoring the 99.9% percentile). The positive impact of shorter walltime for GPU jobs is higher throughput for the scheduler and shorter queuing times. Not unexpectedly, the queuing time for multi-GPU jobs was quite a bit higher. All in all, 50% of the GPU jobs started in 2.5 hours while 90% started within the day.
The previous queuing times are averages for the entire year, which flattens out very busy moments when users can experience much longer queuing times. The following graph break down queue times by month:
Average queuing time on GPU nodes by month in 2025#
As expected, during busy periods on the cluster, queuing times were higher but on average the 50th percentile queue time remained low. The spike for October has no clear explanation. The load was not significantly different.
The weekend effect is also observed for GPU jobs, although it is less pronounced. Oddly enough, jobs submitted on a Thursday also had a distinctly lower queuing time.
Monthly active users on GPU nodes, grouped by type#
Looking at the active users per month, we see that the number of GPU users was quite stable over the year. However the sharp increases in March and November pushed the yearly growth rate into positive territory, surpassing the 2024 level.
Note
In the following tables, which distribute usage across different entities and user types, you will find two special categories:
Non-VUB are external users from other VSC Sites
Students are students up to the Master level that are not affiliated to any department or research group
Faculty |
Usage |
|---|---|
Department Research |
0.2% |
Department ICT |
1.4% |
non-VUB |
1.5% |
Faculty of Medicine and Pharmacy |
4.4% |
Students |
12.3% |
Faculty of Social Sciences and Solvay Business School |
20.4% |
Faculty of Engineering |
24.5% |
Faculty of Sciences and Bioengineering Sciences |
35.3% |
We only show those faculties that use at least 0.1% of total compute time. ‘Students’ usage dropped by 10% compared to 2024, while the top 3 faculties increased their usage. The ‘Faculty of Social Sciences’ and ‘Solvay Business School’ stand out as major GPU users, as they are comparatively small users of Hydra’s CPU-only compute nodes.
Department |
Usage |
|---|---|
Research coordination |
0.2% |
Materials and Chemistry |
0.2% |
Electricity |
0.2% |
Applied Mechanics |
0.4% |
Basic (bio-) Medical Sciences |
1.1% |
Pharmaceutical and Pharmacological Sciences |
1.2% |
Administrative Information Processing |
1.4% |
Non-VUB |
1.5% |
Department of Water and Climate |
1.6% |
Chemistry |
2.0% |
Clinical sciences |
2.1% |
Department of Bio-engineering Sciences |
2.5% |
Engineering Technology |
5.3% |
Electrical Engineering and Power Electronics |
6.2% |
WIDSWE |
7.7% |
Electronics and Informatics |
10.5% |
Students |
12.3% |
Business technology and Operations |
20.3% |
Informatics and Applied Informatics |
23.0% |
The overview of used compute time per department reveals the actual use of the GPUs per scientific domain. The top 3 of departments have not changed, but the list has grown longer compared to 2024. Some departments (like ‘WIDSWE’) have grown their GPU usage considerably. A major newcomer is ‘Clinical Sciences’ which now uses more than 2% of the GPU time. We also welcome the departments of ‘Applied Mechanics’, ‘Electricity’ and ‘Materials and Chemistry’ as new users of our GPU nodes.
Employment Type |
relative |
|---|---|
Professor |
0.1% |
Administrative/technical staff |
1.4% |
Non-VUB |
1.5% |
Guest professor |
6.1% |
Students |
12.3% |
Researcher |
78.6% |
Software Usage#
In 2025, there were 3,155 modules available across all partitions of Hydra, representing 1,317 unique software installations and 3,844 unique extensions. The following chart shows the most used software by counting the number of users loading the module directly on the terminal or in their jobs.
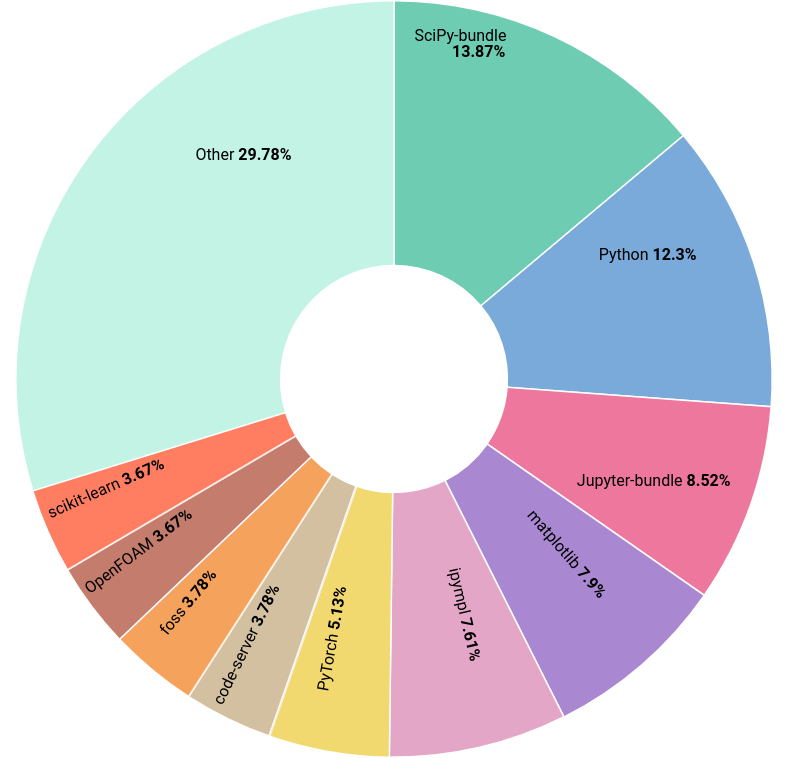
Top software modules loaded during 2025 in VUB HPC#
Following last year’s trend, Python remains the dominant language environment in the cluster, with the top 6 software modules all being Python packages.
Open OnDemand Usage#
In 2025 we launched a web portal at portal.hpc.vub.be based on the Open OnDemand platform. It has been a game changer for our user community, greatly lowering the barrier to entry to the cluster. Functionally replacing the HPC notebook platform, it offers more flexibility and extensibility, which led to the decommissioning of the notebook platform in September.
The Anansi cluster was launched last year with the goal to offer an interactive service to test/develop/debug on the cluster. The CPU cores are oversubscribed, which means they can be used by multiple jobs at once. Of the CPU jobs, 90% started immediatly and 99% within 2 hours. For GPU jobs the resources are more limited and the queueing time reflects this: 90% of the jobs started within 3 hours. To improve the interactive experience on the cluster, we are limiting the amount of resources a single user can use. This year, we extended the Anansi cluster with 2 new nodes, each offering 4 NVIDIA L40S GPUs for interactive use.
In total, 10,513 interactive sessions were started in 2025 on portal.hpc.vub.be. Those sessions were launched by 313 unique users on both Hydra and Anansi. This means that 52% of the total userbase has used the portal at least once.
Name |
Sessions |
Users |
|---|---|---|
Slicer |
50 |
11 |
GaussView |
91 |
18 |
ParaView |
99 |
9 |
MATLAB |
123 |
23 |
Tensorboard |
137 |
9 |
VNC Desktop v2 |
210 |
21 |
Rstudio |
657 |
33 |
Interactive Shell |
953 |
128 |
VS Code Tunnel |
1154 |
62 |
VS Code Server |
1552 |
76 |
Jupyter lab |
2159 |
136 |
VNC Desktop |
3098 |
134 |
The desktop environment is clearly the most popular application, which was a surprise to the SDC team.
Employment Type |
Users |
Of total |
|---|---|---|
Guest professor |
1 |
14.3% |
UZB |
1 |
50.0% |
Professor |
9 |
64.3% |
Administrative/technical staff |
12 |
100.0% |
Non-VUB |
26 |
56.5% |
Students |
97 |
56.4% |
Researcher |
167 |
54.0% |
User support#
We received 999 support requests (incidents) from users, which is again a substantial increase compared to 2024. The monthly distribution follows the academic year and the system load.
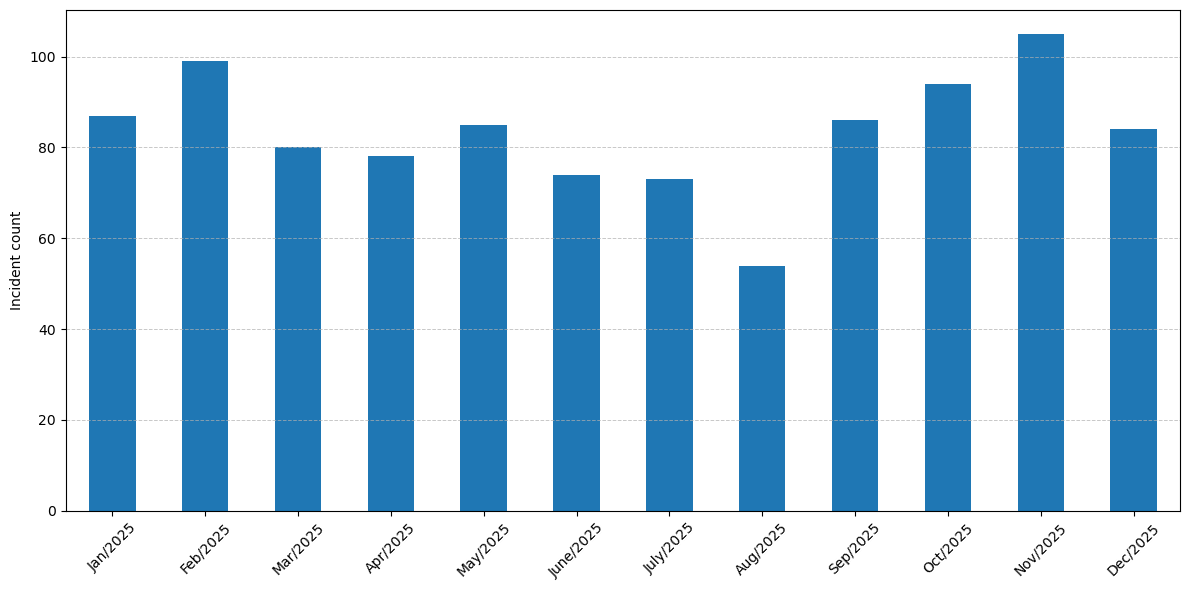
Support tickets handled by the Scientific Data & Compute team#
Business service |
Incident Count |
Percentage of Incidents |
|---|---|---|
Pixiu Scientific Research Data |
336 |
33.6% |
HPC Scientific Software Installation |
176 |
17.6% |
HPC Jobs Troubleshooting |
144 |
14.4% |
HPC Consultancy |
129 |
12.9% |
HPC Data |
111 |
11.1% |
HPC VSC Accounts & Access |
70 |
7.0% |
HPC Tier-0 & Tier-1 Projects Advice |
19 |
1.9% |
Account and Access Management |
10 |
1.0% |
Softweb Software & Licenses |
3 |
0.3% |
HPC Workflow Building & Porting |
1 |
0.1% |
From the HPC side, the majority of incidents (~32%) are related to problems with jobs or requests for new software installations. But one third of the incidents are related to Pixiu, which is huge increase compared to 2024. It must be noted that not all those tickets are related to problems with the service, the majority are request for new accounts on Pixiu.
We managed to resolve the large majority of the incidents within 5 working days.
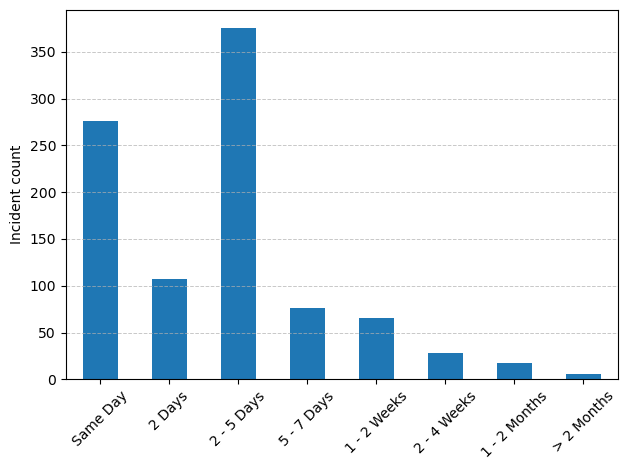
Time to resolution of support tickets handled by the Scientific Data & Compute team#
Compared to 2024, we see that on average it took more time to get to a solution for the incidents. This is probably related to the increase in number of incidents for the Pixiu service, where it is often impossible to provide an immediate solution.
Tier-1#
There were 3 calls for projects in 2025 for VSC Tier-1 (Hortense). In total, 18 starting grants were requested by VUB researchers, and 7 full project proposals were submitted across these 3 calls. All 7 submissions were accepted, resulting in a 100% success rate.
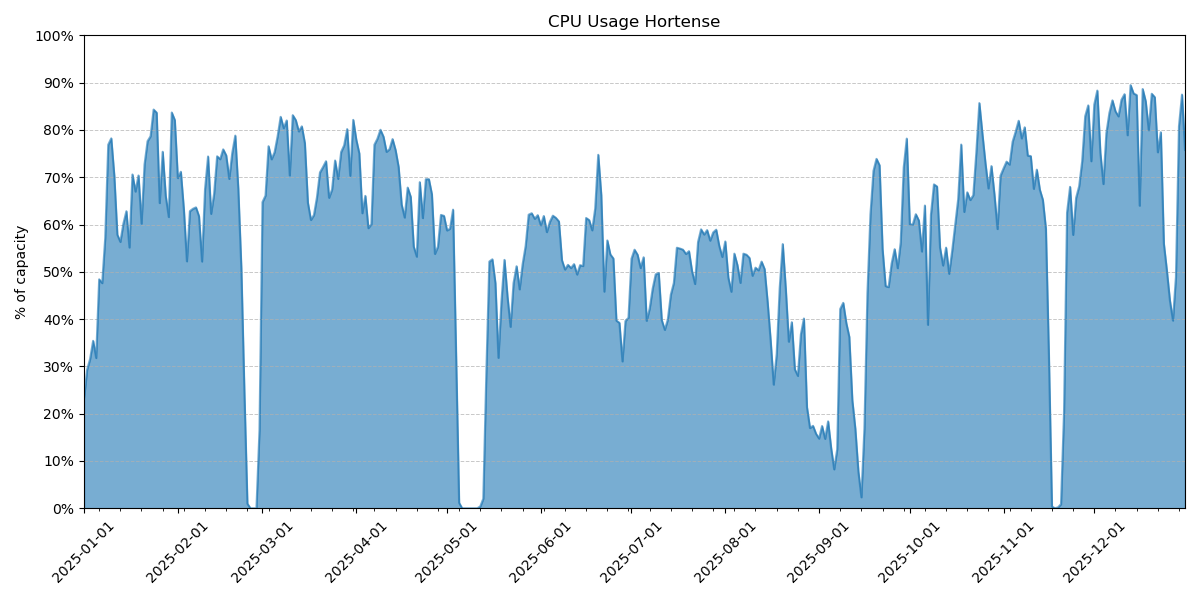
Usage of CPU Hortense in 2025#
VUB researchers used around 6.1% of the academic CPU compute time on Tier-1.
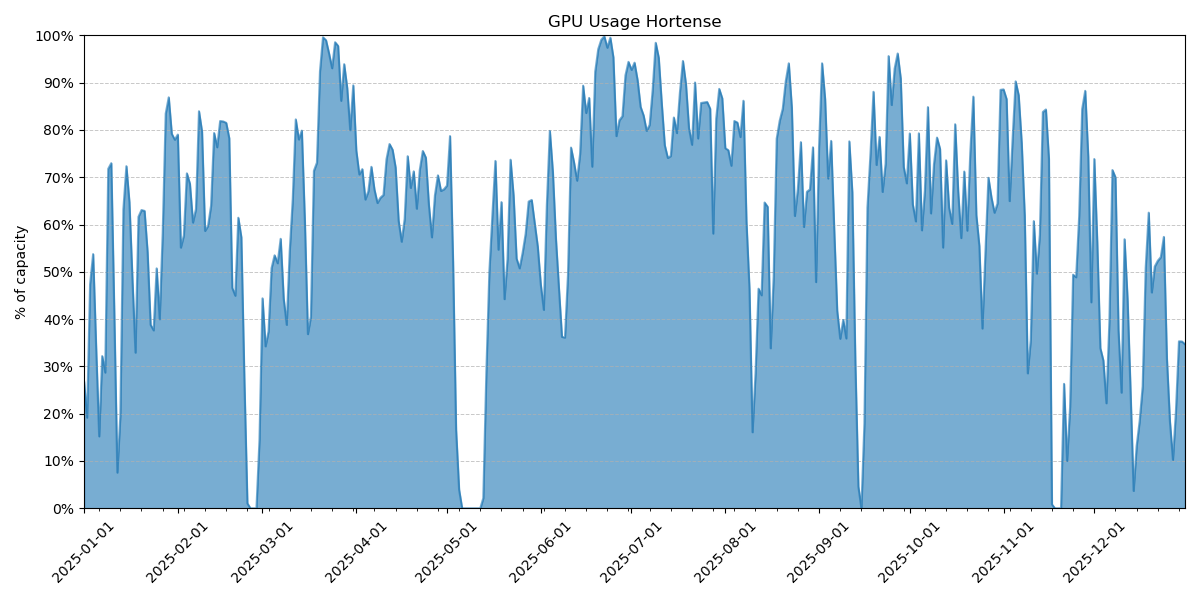
Usage of GPU Hortense in 2025#
VUB researchers used around 7.3% of the academic GPU compute time on Tier-1.
Compared to 2024, we see an increase in the number of starting grants requested by VUB researchers, while the number of full projects submitted dropped (11 in 2024). Not unexpectedly, the share of CPU usage by VUB researchers decreased, while the GPU share increased slightly.
A lot of time and effort was spent in 2025 promoting HPC within the VUB, and the results are starting to show in the number active users, but not yet in Tier-1 usage. We hope this will lead to more projects for VUB’s Tier-1 system, Sofia, in 2026.
VSC User survey#
At the end of 2025, the second edition of the VSC-wide user survey was conducted. This survey encompasses all VSC services (all Tier-1 components and all Tier-2 systems).
See also
The results of the 2024 survey can be found on Overview of 2024.
The invitation to take part in the survey was sent out on 8 December 2025, and the survey closed on 15 January 2026. In total, 562 people responded, and 430 of those completed the survey in full, which is at the same level as in 2024. There were 76 people affiliated with the VUB among the respondents, an increase of 38% compared to 2024. Thank you for the feedback! We really appreciate it.
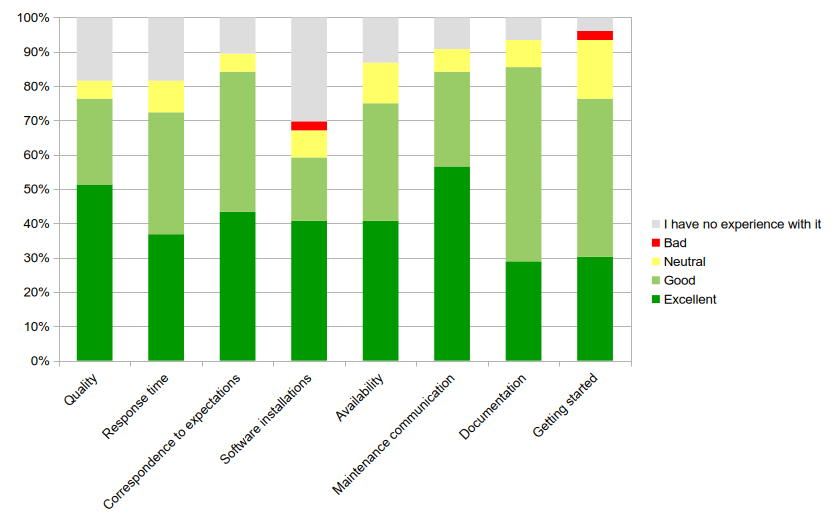
Responses from VUB users to the VSC user survey conducted at the end of 2025#
Looking at the responses from those respondents who indicated that they use VUB’s Tier-2 ystems (Hydra, Anansi), we obtain the following percentages of users who rated the service as Excellent or Good (excluding responses marked No Experience):
2025 |
2024 |
|
|---|---|---|
Quality |
93.5% (58/62) |
98.1% (51/52) |
Response time |
88.7% (55/62) |
98.0% (49/50) |
Correspondence to expectations |
94.1% (64/68) |
88.7% (47/53) |
Software installations |
84.9% (45/53) |
92.9% (39/42) |
Availability |
86.4% (57/66) |
92.6% (50/54) |
Maintenance communication |
92.8% (64/69) |
94.0% (47/50) |
Documentation |
91.5% (65/71) |
89.1% (49/55) |
Getting started |
79.5% (58/73) |
83.6% (46/55) |
In general, we are quite happy with these results, as they show that our services are highly valued by our users. Compared to 2024, we observe a small decrease in most categories, while the score for Correspondence to expectations improved. In particular, we are pleased to see that the score for Documentation has evolved in a positive direction.
We note that 42% of respondents selected No Experience for the Software installations category. This suggests that users are either satisfied with the software available on the VUB clusters or prefer to install their own software. The training on how to install software might have helped here: vscentrum/gssi-training
Getting started on Hydra still receives the lowest score, which is expected given the significant learning curve. In response, we have provided additional training sessions for specific user groups and launched the VSCdocVUB OnDemand web portal, which significantly lowers the barrier to entry. However, these efforts have not yet resulted in an improved Getting started score. We will therefore continue to invest in training opportunities and seek further ways to improve the user experience. Any suggestions are welcome!
The score for Availability has dropped by 6%. There was only one unplanned downtime of Hydra in 2025 to address a potential security issue. All other updates were carried out without a full downtime. The lower score on this item might be more related to queue times and resource availability.
Satisfaction with Response time has dropped by 9%. The higher number of users was felt at the helpdesk on several occasions, creating a backlog of support tickets. Although we managed to resolve this backlog, it resulted in increased response times for support tickets.
From the free-text comments, three main suggestions and requests emerged:
More GPUs
Perceived long queue times
Documentation
As in 2024, GPUs remain in high demand, and queue times can occasionally exceed
acceptable limits. We continue to actively encourage heavy GPU users to migrate
to Tier-1 resources, and we have recently announced the
new hopper_gpu partition
on Hydra. For interactive use, users are encouraged to select GPU shards in
the ada_gpu partition of the anansi cluster.
Documentation will always remain a work in progress. We regularly update and improve our documentation and continue to integrate VUB-specific material into the VSCdocVSC documentation. Users are encouraged to notify us whenever documentation is unclear, incomplete, or contains errors.
Some respondents provided contact details along with specific comments. We will follow up with these users individually to help resolve their issues.
Finally, we conclude this report with several very positive comments that we received spontaneously through the survey:
“The ict helpdesk people are very responsive.”
“Amazing work and support”
“I have only had excellent interactions with the HPC staff at the VUB! They have helped set up my software on the HPC, and even helped me debugging some specific problems.”
Pixiu#
Pixiu is the storage platform of VUB dedicated to host research data. It offers high capacity, with more than 2 petabytes of storage, and flexibility through its software-defined storage platform.
Pixiu is owned and hosted by VUB, ensuring the security and privacy of the data stored in it. All parts of the system are located in our own data centres on VUB premises and administered by VUB IT staff.
It stores both the home and data directories for VUB VSC users, along with general research data stored via S3 object storage.
At the end of 2025, it was storing a total of 1.6 PB of data. The largest portion of the storage is dedicated to HPC (hosting VSC_HOME and VSC_DATA) and to backups of VUB production data.
For the object storage there are 106 groups with 288 buckets. In 2025, the number of buckets grew by 188, distributed across 73 groups. We created 908 credentials for using Pixiu; not all of these correspond to individual users, as some are for machines or applications. This brings the total number of credentials in use on Pixiu to 1,663.
Most important changes on Pixiu in 2025:
Pixiu has two identical components in two datacentres. In 2025, we moved the part that was located in the ULB datacentre on the Solbosch campus to the Nexus datacentre in the Researchpark Zellik.
This was a complex operation that required extensive planning and coordination. Thanks to the thorough preparation, the actual move went smoothly and without any significant downtime.
To prepare, an additional 2 PB of storage was purchased and installed in the Nexus datacentre. This system contained a full backup of all the data, ensuring that there were always two copies of each bit of data on Pixiu.
Pixiu was extended with 76 TB of NVMe flash storage, usable both as a cache for object storage and as high-performance storage for HPC, storing
appsandVSC_HOME.The goal was to switch to a synchronous replication between the two datacentres. Currently, in the event of a disaster at the primary datacentre, we could lose the last few minutes of data. With the new setup, this should be reduced to (micro)seconds. An extra benefit is that both datacentres can be used simultaneously. However, this change turned out to be more complex than expected. The switch is planned for early 2026. Once completed, the additional 2 PB of storage will be integrated into Pixiu, bringing the net capacity to 3 PB.
In 2025 we set up a new Globus endpoint to connect Pixiu to the Globus data transfer service. This allows users to easily transfer data between Pixiu and other Globus-connected storage systems worldwide. The endpoint is available as
VUB Pixiu. All new accounts created since September have direct access, while older accounts still need to be migrated. Through Globus, it is also easy to VSCdocshare data with anybody.