Hydra Overview 2023#
Year 2023 of the SDC team was marked by the award of the new Flemish Tier-1 supercomputer, which will be managed by us and hosted by VUB in the Green Energy Park. Our commitment with the rest of our services stays unchanged and now it is time to look at the state of the Hydra cluster, VUB’s Tier-2 HPC infrastructure. 2023 was an eventful year for Hydra and we have collected some statistics on the usage of the cluster by our users.
A quick glance:
2.2 centuries of single core CPU compute time were used.
17 years of GPU compute time were used.
882,875 jobs were run.
About 20% of the jobs were responsible for 99% of the used compute time.
Most important changes in 2023:
The launch of the notebook platform: New web portal for notebooks on the HPC
The replacement of the scratch filesystem: Big upgrade for Hydra: New Scratch
The upgrade to RockLinux 8: Big upgrade for Hydra: Operating system and software
The addition of 2 extra GPU nodes: Extra Ampere GPUs in Hydra
The decommissioning of the last remaining Ivy Bridge nodes: Big upgrade for Hydra: New compute nodes
The automation of processing VSC account requests: accounts are approved automatically for staff and for students there is a request flow through VUB’s ServiceNow portal.
Users#
There were 349 unique users of Hydra in 2023 (i.e. submitted at least one job):
327 unique users of the CPU nodes
110 unique users of the GPU nodes
Split of all users by personnel type:
Employment Type |
Users |
Relative |
|---|---|---|
Professor |
7 |
2.0% |
Administrative/technical staff |
15 |
4.3% |
Non-VUB |
20 |
5.7% |
Student |
127 |
36.5% |
Researcher |
179 |
51.4% |
CPU Usage#
On average the load on the cluster was 61%. Usage was quite steady across the year, only experiencing low use on Christmas and the maintenance at the end of November. Nonetheless, there are large fluctuations that fit a weekly cycle. Usage on weekends is systematically low, so if you are in rush to get your jobs started quickly that is the best time to do it.
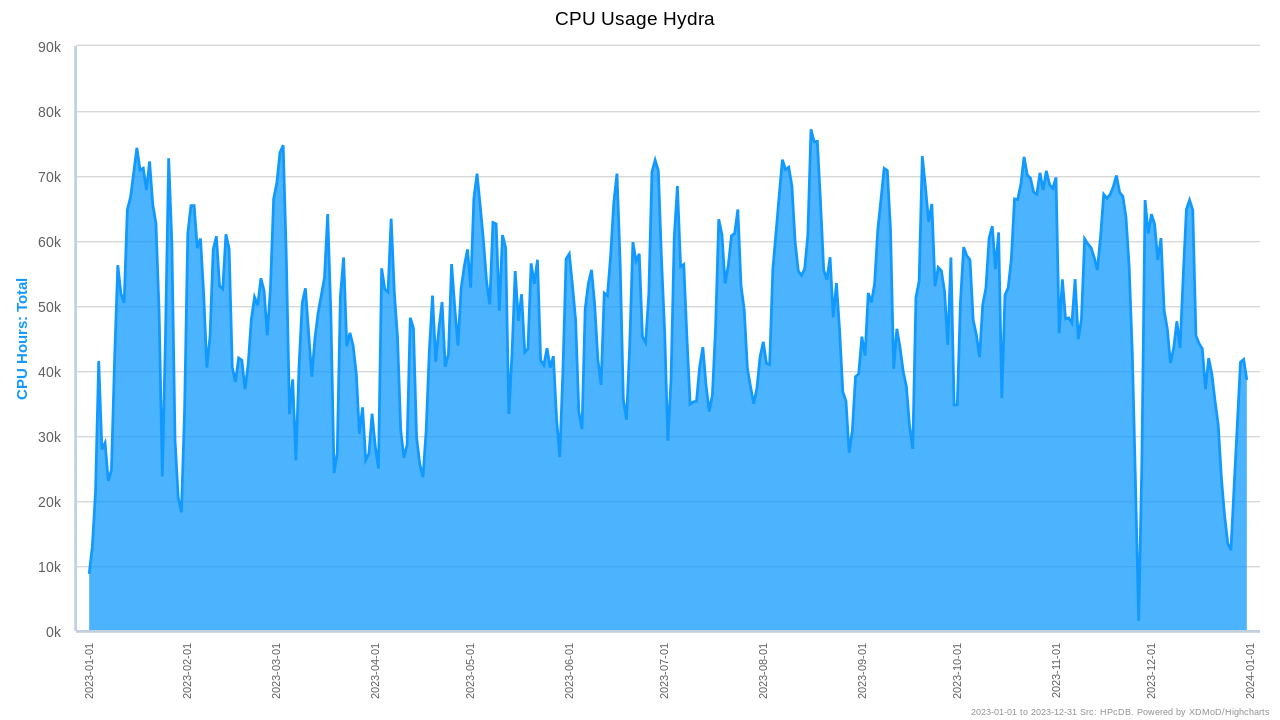
About 75% of the used compute time comes from just 10% of the users.
Split of used CPU compute time per VSC institute:
Institute |
Usage |
|---|---|
VUB |
92.4% |
UAntwerpen |
0.2% |
KULeuven |
5.4% |
UGent |
2.0% |
For the remainder of the analysis we only consider jobs which ran for at least one hour (shorter ones are assumed to be test or failed jobs). These jobs represent 98% of the used compute time.
Profile of a typical CPU job split in percentiles of the number of jobs:
Percentile |
Cores |
Nodes |
Walltime |
|---|---|---|---|
0.500 |
1 |
1 |
0 days 06:13:07 |
0.750 |
8 |
1 |
0 days 20:00:26 |
0.800 |
8 |
1 |
1 days 03:56:26 |
0.900 |
10 |
1 |
2 days 13:27:20 |
0.950 |
16 |
1 |
3 days 00:00:20 |
0.990 |
40 |
3 |
4 days 23:00:21 |
0.999 |
120 |
10 |
5 days 00:00:26 |
Note
A typical CPU job (90% of all jobs) runs on a single node, uses 10 or less cores and ends in 2.5 days.
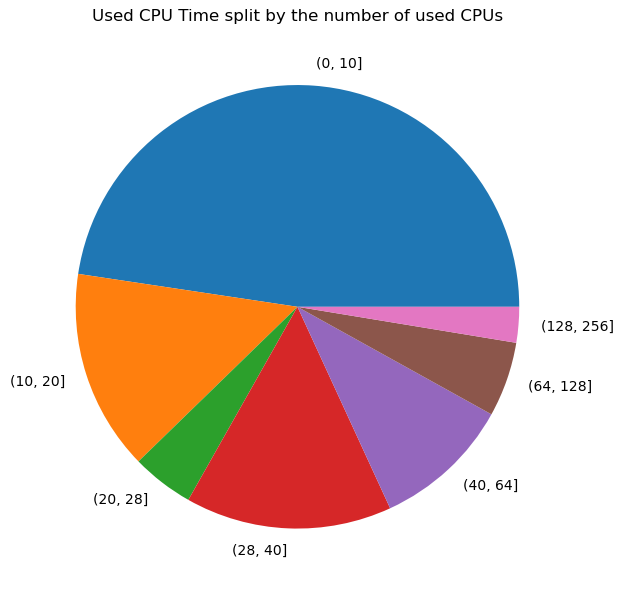
If we look at the number of cores used as function of the used CPU compute time by those jobs, we see that this matches the previous percentiles based on number of jobs:
The number of used nodes as function of the used CPU compute time also matches:
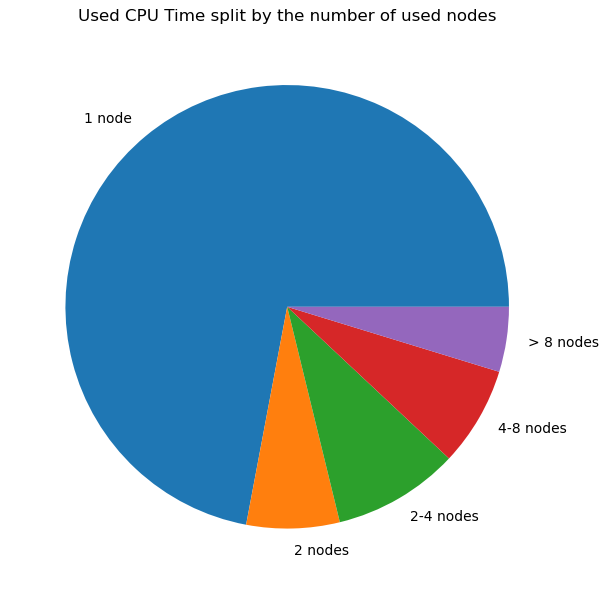
In conclusion:
There were many small jobs: almost 75% of the jobs ran on a single node and almost 50% on 10 or even less cores.
There were many short jobs: 80% ran less than 28 hours, 50% even less than 6 hours.
As the load in the cluster was not that high, the queuing time for jobs was short for the large majority of jobs (>90%):
Percentile |
Total |
Single core |
Multicore |
Single Node |
Multi Node |
|---|---|---|---|---|---|
0.50 |
0 days 00:00:29 |
0 days 00:00:24 |
0 days 00:12:51 |
0 days 00:00:29 |
0 days 00:00:28 |
0.75 |
0 days 05:35:26 |
0 days 02:45:25 |
0 days 13:20:19 |
0 days 05:34:22 |
0 days 07:29:26 |
0.80 |
0 days 09:55:43 |
0 days 04:27:06 |
0 days 22:11:46 |
0 days 09:53:49 |
0 days 12:37:38 |
0.90 |
1 days 08:25:12 |
0 days 16:25:46 |
1 days 21:53:08 |
1 days 08:18:35 |
1 days 20:54:25 |
0.95 |
2 days 06:30:11 |
1 days 10:24:51 |
4 days 01:44:01 |
2 days 06:08:47 |
4 days 21:30:18 |
0.99 |
6 days 11:03:10 |
2 days 22:28:38 |
8 days 16:31:31 |
6 days 06:14:09 |
10 days 20:01:25 |
The column Total shows the queuing time per percentile for all CPU jobs while the other columns show it for the different kind of jobs.
As we can see, 50% of all jobs start immediately, regardless of the resources requested. Queuing time depends on the overall load of the cluster and the resources requested by the job. The more resources requested, the higher the queuing time for that job. But even including multi-node jobs, 75% of all jobs start within hours.
The previous queuing times are averages for the entire year, which will flat out very busy moments when users can experience much longer queuing times. The following graph splits out queue times on a monthly basis:
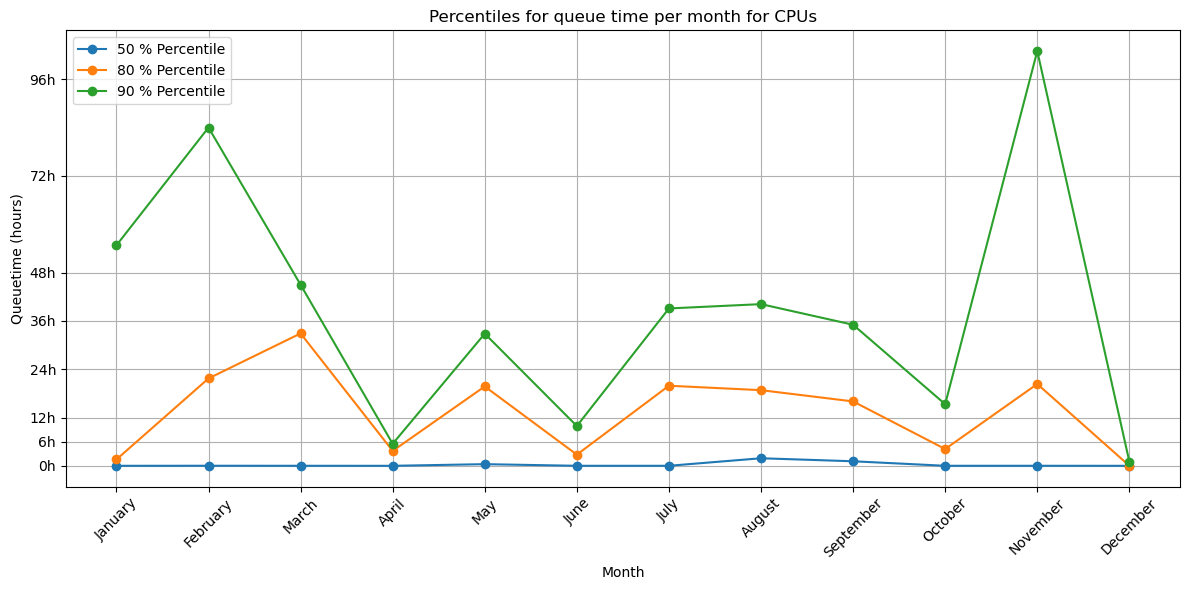
The high peak in November is due to the planned maintenance that month.
Due to the large quantity of short jobs submitted to the cluster, we see that the queuing time on Saturday and Sunday is significantly shorter than during the rest of the week (about 50% shorter).
If we look at the active users per month, we see no surprises: May and November are the busiest months:
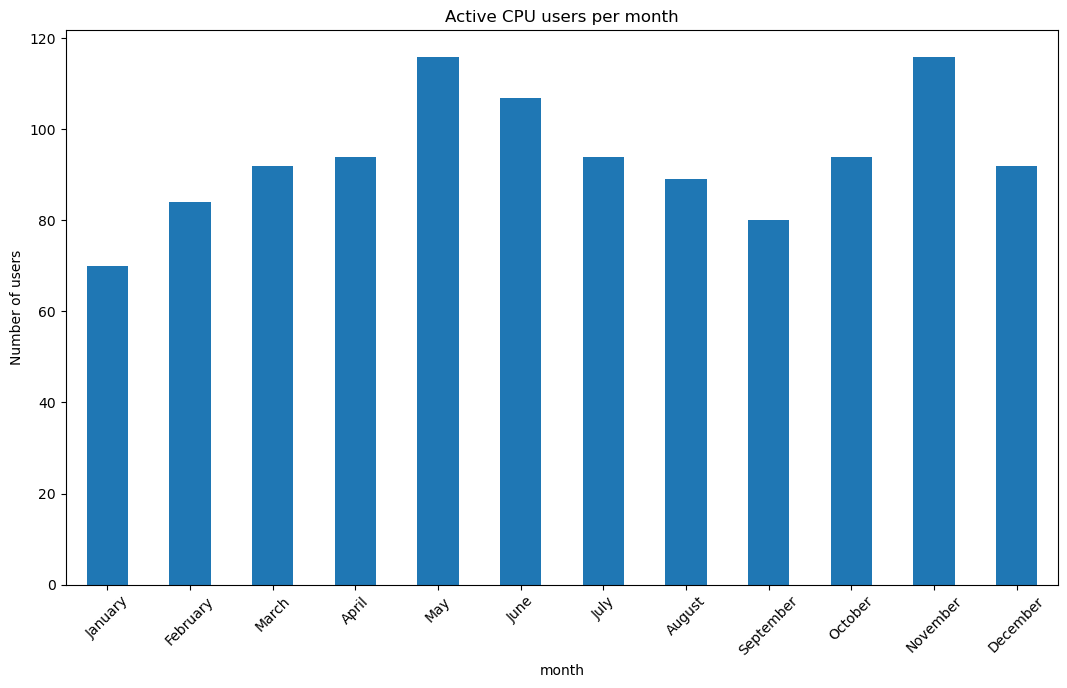
Despite the higher number of users, the queuing time in May does not stand out.
Used compute time by faculty:
Faculty |
Usage |
|---|---|
unknown |
0.1% |
Rectoral services |
0.2% |
Faculty of Medicine and Pharmacy |
0.3% |
Departement ICT |
1.3% |
non-VUB |
7.7% |
Faculty of Engineering |
18.9% |
students |
19.7% |
Faculty of Sciences and Bioengineering Sciences |
51.8% |
We only show faculties if they use at least 0.1% of the compute time. Not unexpectedly the Faculties of Sciences and (Bio-)Engineering use the largest share of the CPU compute time.
The overview of used compute time per department reveals the actual use of the cluster per scientific domain:
Department |
Usage |
|---|---|
unknown |
0.1% |
Clinical sciences |
0.2% |
Centre Leo Apostel |
0.2% |
Applied Mechanics |
0.3% |
Engineering Technology |
0.4% |
Electrical Engineering and Power Electronics |
0.4% |
Applied Physics and Photonics |
0.4% |
Physics |
0.6% |
Administrative Information Processing |
1.3% |
Department of Water and Climate |
1.4% |
Geography |
1.4% |
Department of Bio-engineering Sciences |
3.0% |
Electronics and Informatics |
5.1% |
non-VUB |
7.7% |
Materials and Chemistry |
10.8% |
Informatics and Applied Informatics |
16.0% |
students |
19.7% |
Chemistry |
30.6% |
Used compute time split over the different types of personnel:
Employment Type |
Usage |
|---|---|
Administrative/technical staff |
1.3% |
Professor |
6.8% |
Non-VUB |
7.7% |
Student |
19.7% |
Researcher |
64.5% |
GPU Usage#
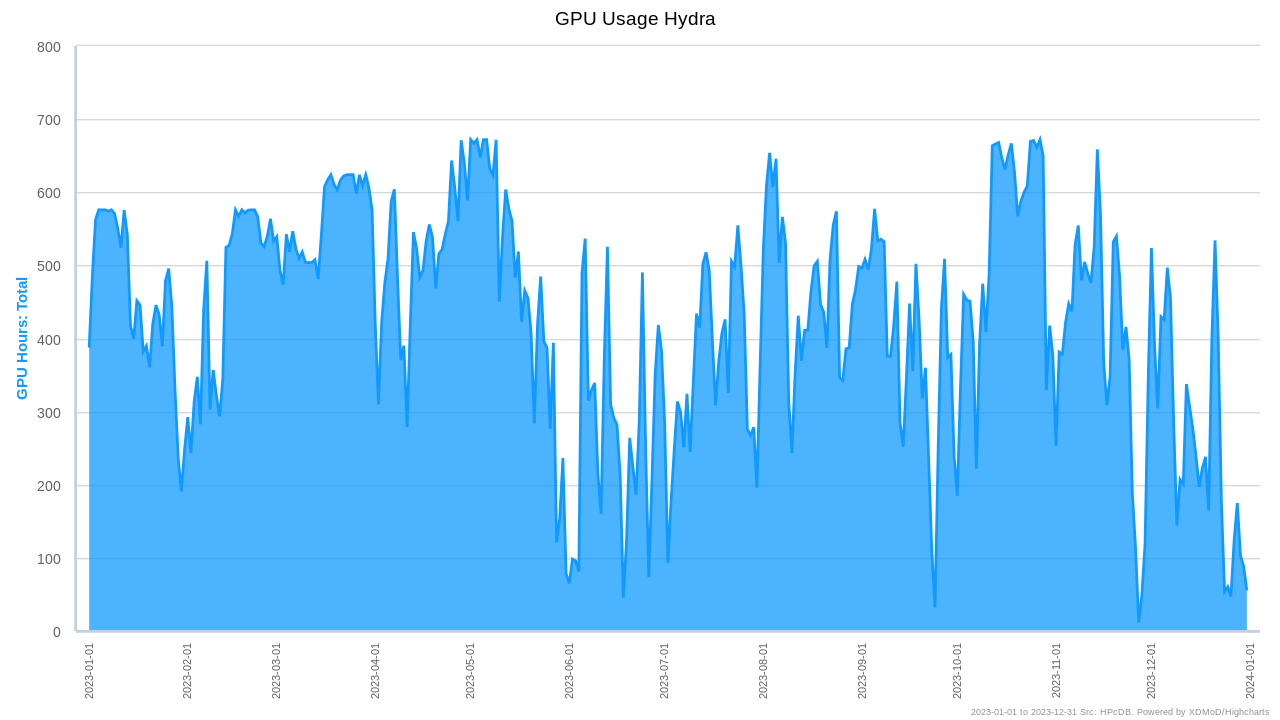
On average the load on the cluster was 66% with large fluctuations at different periods of the year. However, it must be noted, that at the time of writing we are already seeing a very different pattern for 2024, where all GPUs are almost all the time at 100% of use.
Analogous to the CPU nodes, about 75% of the used GPU time comes from just 10% of the users.
Split of used GPU time per VSC institute:
Institute |
Usage |
|---|---|
VUB |
95.2% |
UAntwerpen |
0.0% |
KULeuven |
4.8% |
UGent |
0.0% |
For the remainder of the analysis we only consider jobs which ran for at least one hour (shorter ones are assumed to be test or failed jobs). These jobs represent 99% of the used GPU time.
Profile of a typical GPU job split in percentiles of the number of jobs:
Percentile |
GPUs |
Nodes |
Walltime |
|---|---|---|---|
0.500 |
1 |
1 |
0 days 05:17:58 |
0.750 |
1 |
1 |
0 days 14:52:08 |
0.800 |
1 |
1 |
0 days 20:00:23 |
0.900 |
1 |
1 |
1 days 23:52:24 |
0.950 |
2 |
1 |
3 days 12:00:23 |
0.990 |
2 |
1 |
5 days 00:00:14 |
0.999 |
3 |
3 |
5 days 01:00:14 |
Note
A typical GPU job (90% of all jobs) uses a single GPU and runs for less than 2 days.
If you look at the number of GPUs used as function of the used GPU time by those jobs, we see that this matches the previous percentiles based on number of jobs:
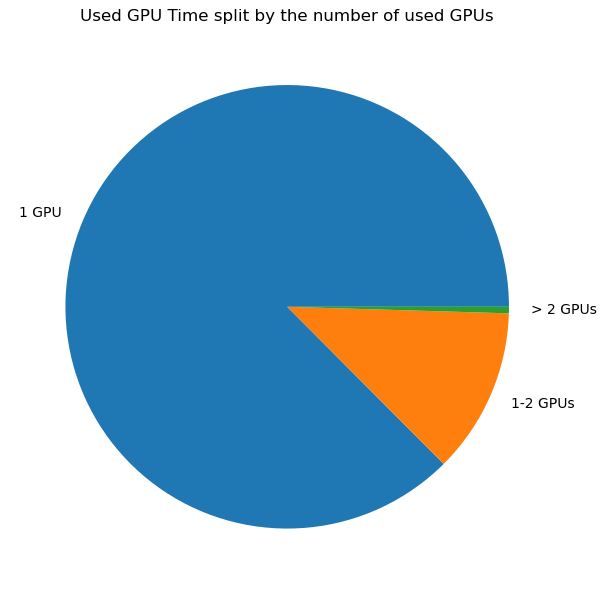
In conclusion:
The large majority of GPU jobs (87%) uses a single GPU
There are many short GPU jobs: 80% runs for less than 20 hours, 50% for less than 5.3 hours.
The number of GPU resources in Hydra is a lot smaller than the CPU resources and this is reflected in the queuing time. Next to that we see a general uptake in the use of AI/ML techniques and thus demand for GPU resources.
Percentile |
Total |
Single GPU |
Multi GPU |
|---|---|---|---|
0.500 |
0 days 00:03:02 |
0 days 00:02:49 |
0 days 00:07:33 |
0.750 |
0 days 10:32:06 |
0 days 11:01:59 |
0 days 07:09:08 |
0.800 |
0 days 16:48:57 |
0 days 17:42:07 |
0 days 10:32:14 |
0.900 |
1 days 07:01:41 |
1 days 07:38:42 |
0 days 20:38:01 |
0.950 |
1 days 22:04:21 |
2 days 00:06:24 |
1 days 06:37:29 |
0.990 |
6 days 12:37:27 |
6 days 15:09:16 |
1 days 21:57:30 |
0.999 |
12 days 09:42:56 |
12 days 09:52:20 |
4 days 16:49:17 |
The column Total shows the queuing time per percentile for all GPU jobs while the other columns show it for single and multi GPU jobs.
As we can see, 50% of the GPUs jobs start immediately. Despite the feelings of frustration echoed by many users on the queuing time on GPU resources, it was not very long on 2023: 80% of the jobs started with 17 hours.
The previous queuing times are averages for the entire year, which will flat out very busy moments when users can experience much longer queuing times. The following graph splits out queue times on a monthly basis:
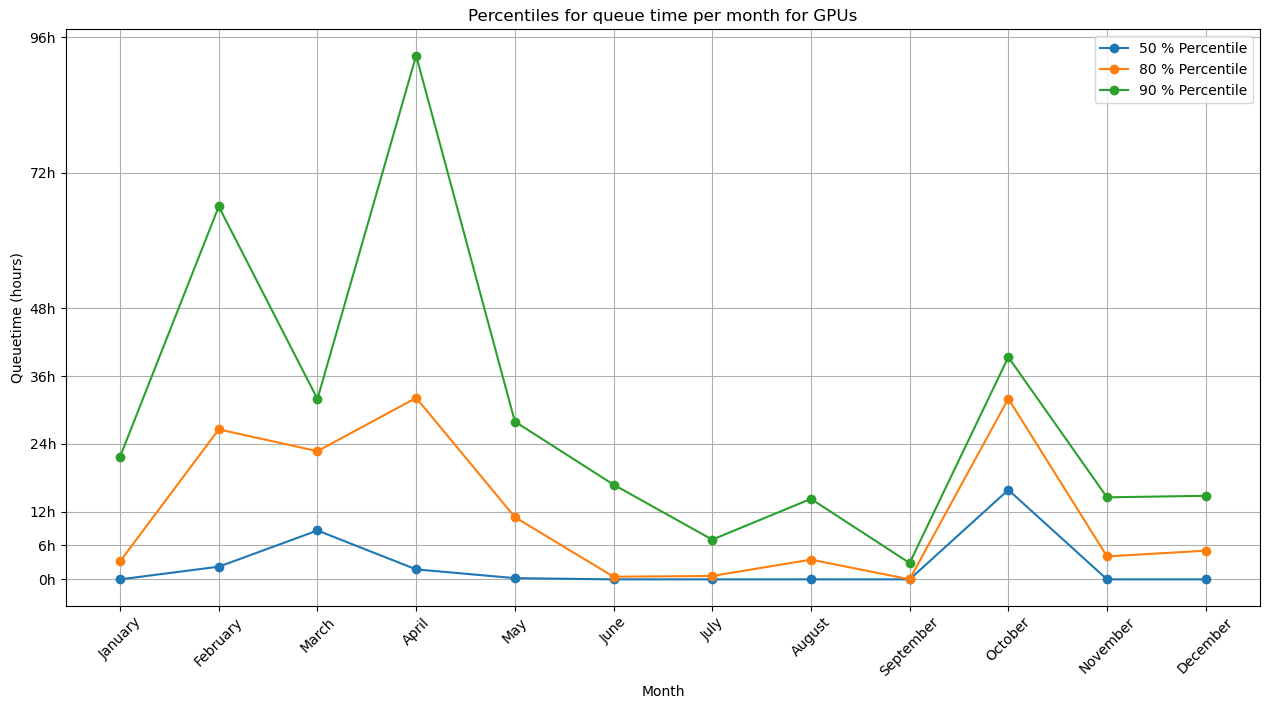
In the first half of the year, the queuing time was clearly higher. The high peaks correspond with high demand for GPUs and given the low amount of GPUs in Hydra, the queue can become long quite easily.
Unlike for CPU jobs, we don’t clearly see a weekend effect in the queuing time of GPUs.
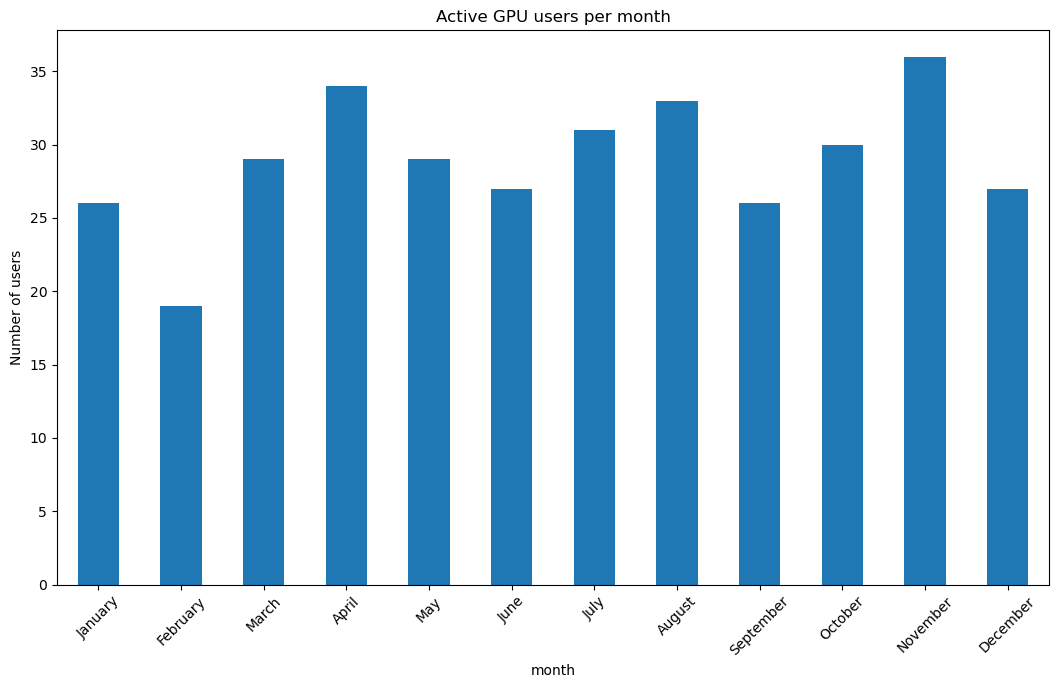
Looking at the active users per month, we see that it seems much more stable than for CPU jobs:
Used GPU time by faculty:
Faculty |
Usage |
|---|---|
Departement ICT |
0.4% |
non-VUB |
4.8% |
students |
12.3% |
Faculty of Engineering |
14.7% |
Faculty of Social Sciences and Solvay Business School |
16.0% |
Faculty of Medicine and Pharmacy |
24.4% |
Faculty of Sciences and Bioengineering Sciences |
27.4% |
We only show faculties if they use at least 0.1% of the compute time. Here we can clearly see the growing importance of AI/ML in all domains of science. The medical and social sciences do not show up in the CPU jobs but are big users of the GPU resources.
The overview of used compute time per department reveals the actual use of the GPUs per scientific domain:
Department |
Usage |
|---|---|
Mathematics |
0.2% |
Administrative Information Processing |
0.4% |
Engineering Technology |
0.5% |
Geography |
1.0% |
Informatics and Applied Informatics |
2.3% |
non-VUB |
4.8% |
Chemistry |
11.2% |
students |
12.3% |
Department of Bio-engineering Sciences |
12.6% |
Electronics and Informatics |
14.0% |
Business technology and Operations |
16.0% |
Pharmaceutical and Pharmacological Sciences |
24.4% |
Used compute time split over the different types of personnel:
Employment Type |
relative |
|---|---|
Professor |
0.2% |
Administrative/technical staff |
0.5% |
Non-VUB |
4.8% |
Student |
12.3% |
Researcher |
82.3% |
Notebook Usage#
The launch of the notebook platform was one of the major events for Hydra in 2023. It has been very well received and has quickly become a major portal to access the cluster by our users. In total, 2971 sessions were started in the first year of the platform, from April 2023 to April 2024. This is equivalent to roughly 8 users on the notebook platform every single day.
Usage of the Jupyter environment:
Notebook Environment |
Sessions |
Percentage |
|---|---|---|
Default: minimal with all modules available |
1216 |
40.9% |
DataScience: SciPy-bundle + matplotlib + dask |
1335 |
44.9% |
Molecules: DataScience + nglview + 3Dmol |
119 |
4.0% |
RStudio with R |
174 |
5.9% |
MATLAB |
128 |
4.3% |
The star of the notebook platform are the data science tools for Python, such
as numpy, pandas and matplotlib. Not only the DataScience
environment itself is almost half of all usage, but also many users launching
the Default environment are manually loading the software module
SciPy-bundle.
Top 5 categories of software modules loaded on the notebook platform:
Data science
SciPy-bundle (1592), matplotlib (1463)
Geography
openpyxl (337), netcdf4-python (295), geopandas (261), rioxarray (211), regionmask (177), h5netcdf (173), Seaborn (159), Cartopy (138), xarray (137), statsmodels (93), h5py (87)
Machine learning
scikit-learn (183), torchvision (109), PyTorch-Lightning (97), Ray-project (59), scikit-image (98), jax (84), TensorFlow (52), tensorboard (47), PyTorch (44)
R
RStudio-Server (180), IRkernel (179)
Chemistry
nglview (119), GROMACS (75)
User support#
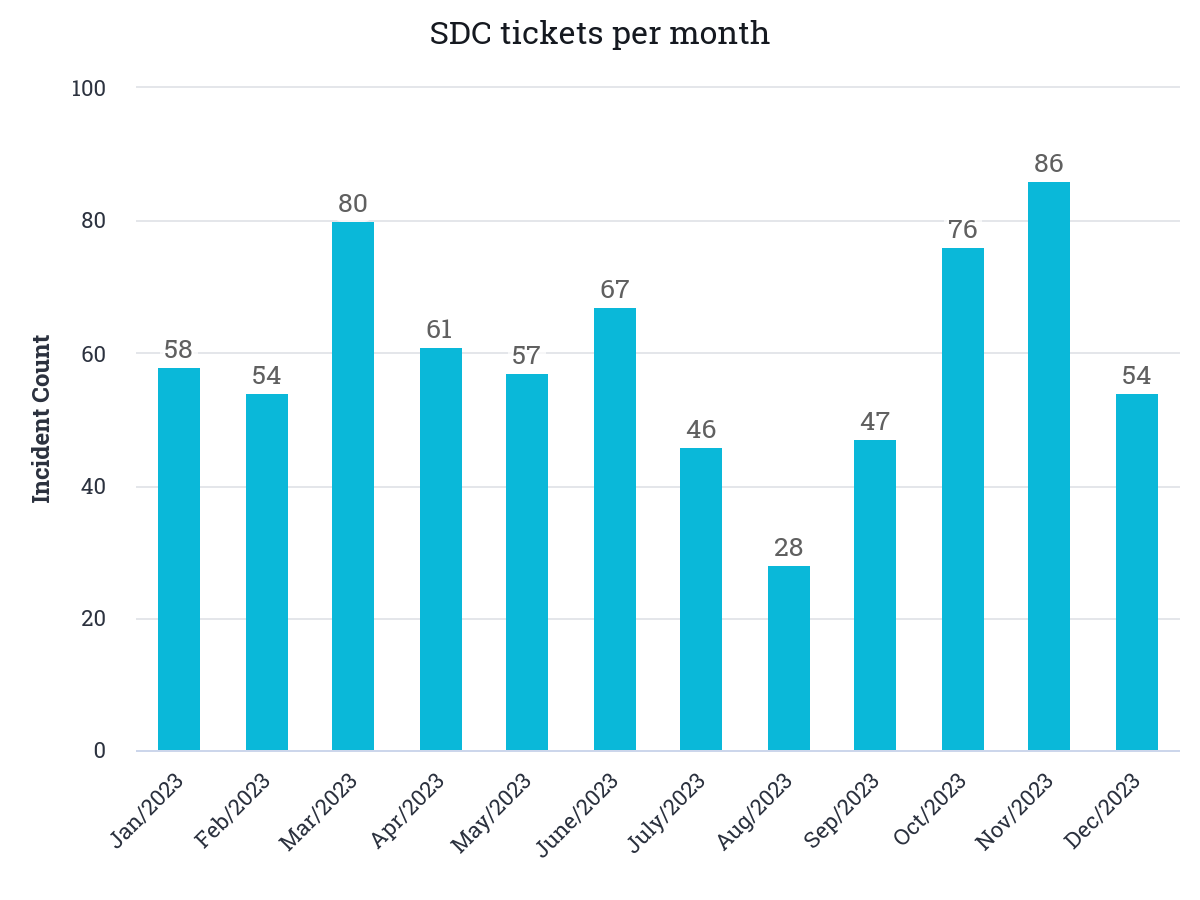
We received 714 support requests (incidents) from users. This is in line with the previous years. Distribution per month is quite stable with the usual lows on summer and Christmas:
Split out per service provided by the SDC team:
Business service |
Incident Count |
Percentage of Incidents |
|---|---|---|
HPC Jobs troubleshooting |
204 |
25.66% |
HPC Scientific software installation |
195 |
24.53% |
HPC Data |
130 |
16.35% |
HPC VSC accounts & access |
96 |
12.08% |
HPC Consultancy |
94 |
11.82% |
HPC Tier-0 & Tier-1 projects advice |
33 |
4.15% |
Pixiu scientific research data |
26 |
3.27% |
Account and Access Management |
3 |
0.38% |
Datacenter hosting |
2 |
0.25% |
Digital Workplace End user hardware and software |
2 |
0.25% |
HPC Tier-2 hardware co-investment |
2 |
0.25% |
Network and Connectivity |
2 |
0.25% |
other |
6 |
0.76% |
The majority of incidents (~50%) are related to problems with jobs or requests for new software installations.
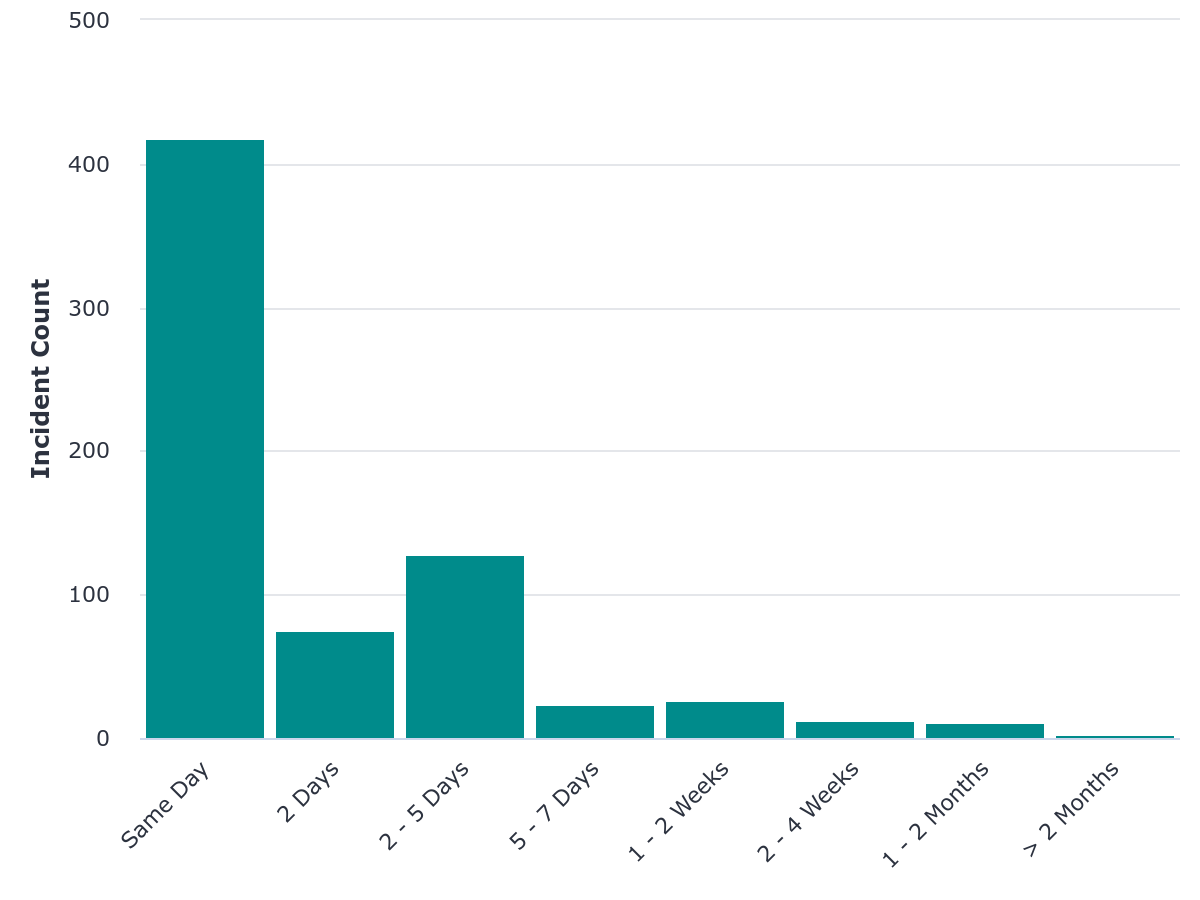
We managed to resolve the large majority of the incidents within one work day:
Tier-1#
There were 3 calls for projects in 2023 for VSC Tier-1 (Hortense). In total 30 starting grants were requested by VUB researchers and 9 full projects were submitted to those 3 calls. 7 of those submissions were accepted, which translates into a 78% success rate.
Usage of CPU Hortense in 2023:
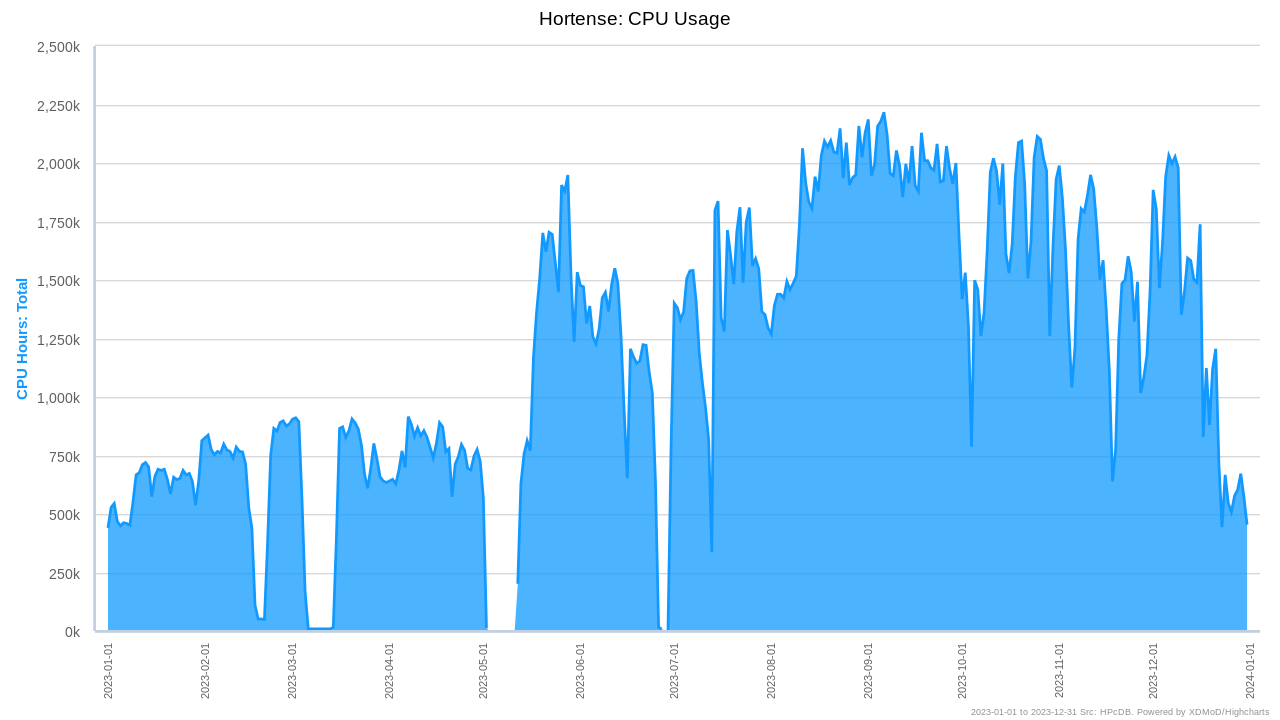
VUB researchers used about 10.3% of the CPU compute time of the academic usage of the Tier-1.
Usage of GPU Hortense in 2023:
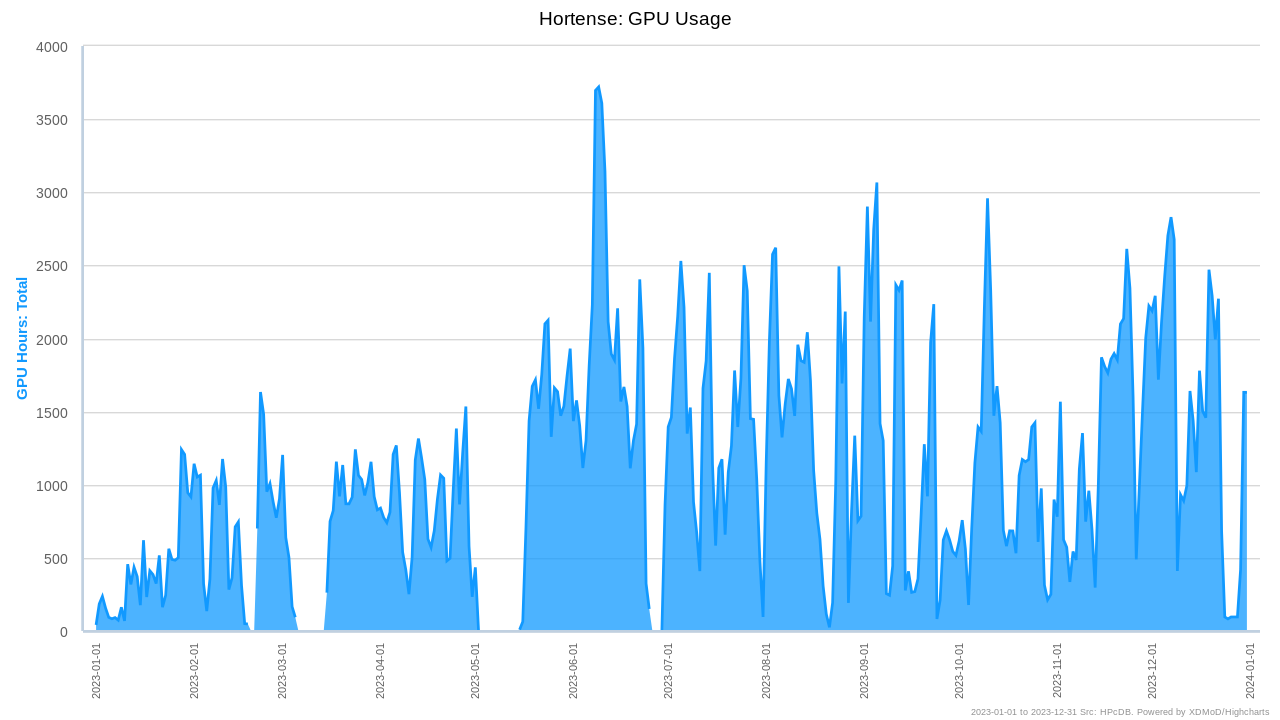
VUB researchers used about 18.8% of the GPU compute time of the academic usage of the Tier-1.
VSC User survey#
At the end of 2023 a VSC-wide user survey was run. This is the successor of the User surveys we ran in 2021 and 2022 that only targeted the VUB community. This survey encompasses all VSC services (all Tier-1 components and all Tier-2 systems).
The invite for the survey was sent out on 7-8 November 2023 and the survey closed on 18 December 2023. In total 467 people responded and 372 of those completed the survey in full. There were 55 people affiliated with the VUB among the respondents (a big thank you for that!).
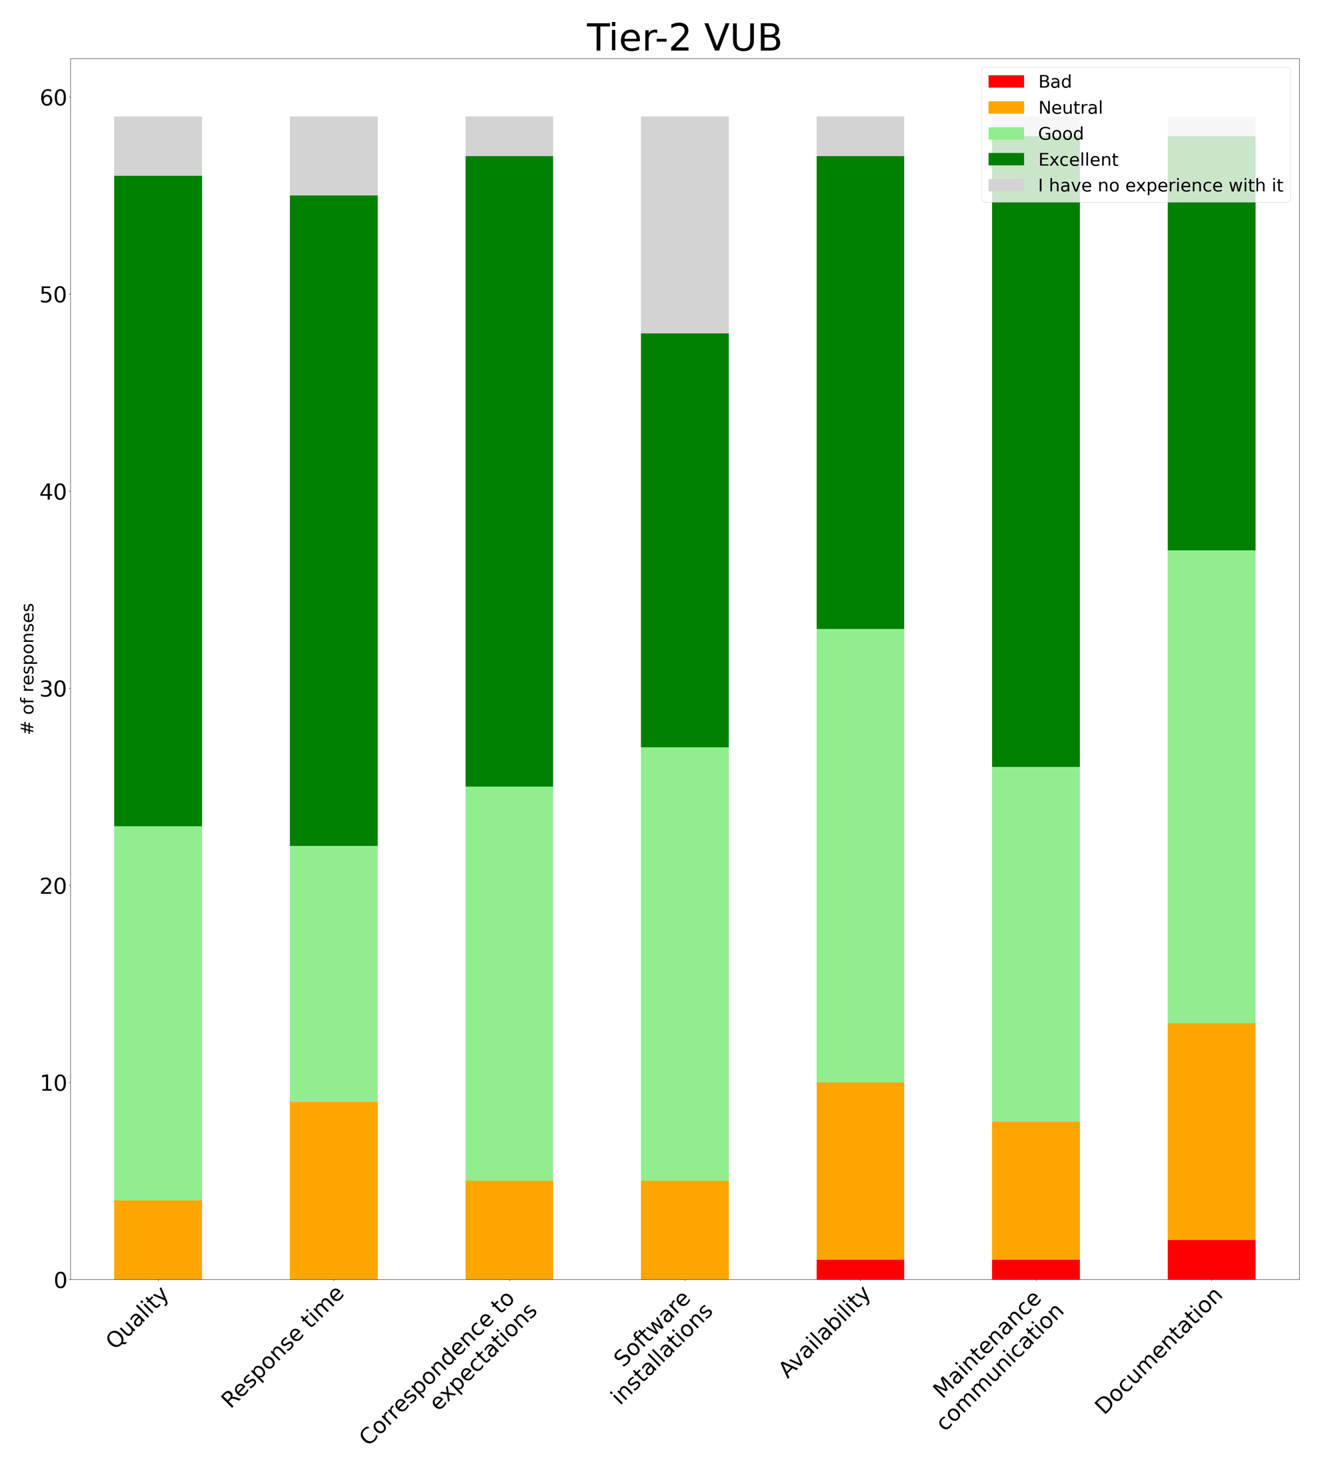
Looking at the answers of those respondents who said they were using VUB’s Tier-2 (Hydra), we get the following percentages of people who rated that service as Excellent or Good (discarding answers that said No Experience):
Quality |
92.7% (51/55) |
Response time |
83.3% (45/54) |
Correspondence to expectations |
91.1% (51/56) |
Software installations |
89.4% (42/47) |
Availability |
83.9% (47/56) |
Maintenance communication |
87.7% (50/57) |
Documentation |
77.6% (45/58) |
In general we are happy with this result as it shows that our services are very positively valued by our users. Documentation was rated as the least good point, which is probably caused by the confusing split of information between VSC docs and our own HPC documentation. VSC docs was already largely re-designed and re-structured on Q3 2023 to improve its usability and now we plan to review our own documentation to integrate as much as possible in the VSC documentation.
In the free comments we found following suggestions and requests:
More GPUs (3)
Queuing time is perceived as too long; Azure used for flexibility (2)
Better solution for interactive work (2)
Better solutions for Master thesis students (1)
More ‘advanced’ and application-specific trainings (2)
We are aware that the GPUs are in high demand and the queuing time on them can be longer than tolerable at times. At this point we try to actively push the biggest users to Tier-1 and we are considering out options to buy extra GPUs.
For short interactive work we have introduced the notebook platform, which has been very well received and also helps introducing master students to the HPC as there is no requirement for SSH keys to access the cluster though it. We are committed to continue improving this new interface to the HPC.
About advanced or application specific training, if you have any ideas on topics for such a training, please let us know at VUB-HPC Support.
Finally, we want to finish this report with several very positive comments that we spontaneously received in the survey:
“In general my experiences with VSC infrastructure are quite positive”
“I think the service is really good!”
“Everything is great for me! The jupyter notebooks are fantastic.”
“I want to stress that VSC has been playing a critical role in our research.”
“Happy about the fact that we have access and can rely on VSC.”