Hydra Overview 2024#

In the year 2024 a lot of time was spent on the tender processes to procure the next VSC Tier-1 supercomputer hosted by VUB. Nevertheless our Tier-2 HPC cluster Hydra did undergo several key changes. It’s time for some statistics on the usage of the infrastructure on 2024.
Highlights of 2024 for Hydra:
2.6 centuries of single core CPU compute time were used
21.2 years of GPU compute time were used
1,500,695 jobs were run. The large majority of them run for less then 1 hour
About 24% of the jobs were responsible for 98% of the used CPU compute time and 96% of the used GPU compute time
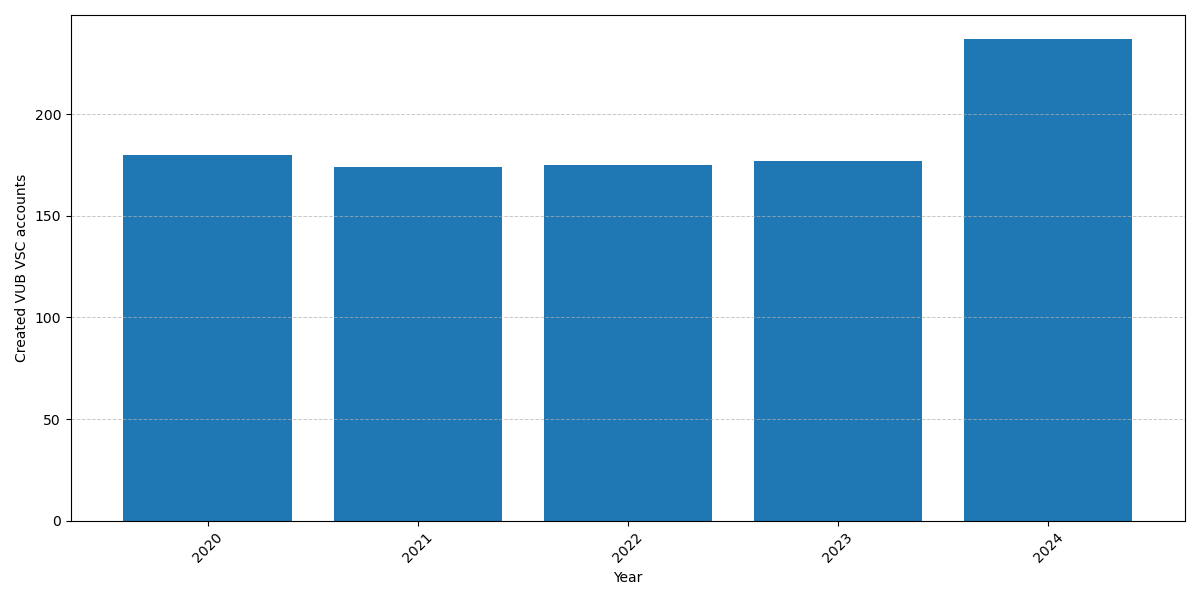
There were 383 unique users active on Hydra in 2024 and 237 new VUB VSC accounts were created
Most important changes in 2024:
20 new worker nodes were added. These feature a Genoa-X CPU (zen4) with an extra-large L3 cache: Hydra system upgrade with brand new nodes
The oldest worker nodes of broadwell generation were decommissioned: Removal of broadwell nodes from Hydra
The flash NVMe pool of the scratch storage was doubled in size:: Hydra scratch flash storage upgrade part 2 on 10 January 2024
The notebook platform was updated to the 2023a generation of modules: Notebook platform environments on 2023a
The Anansi cluster was put into production. This cluster targets interactive use and visualization: New Anansi cluster for notebooks and test/debug jobs
The cluster received an update to RockyLinux 8.10: Minor system upgrade of Hydra
A pilot setup of our new VSCdocOnDemand portal was launched for a select audience of testers
Users#
There were 383 unique users of Hydra in 2024 (i.e. submitted at least one job), compared to 349 in 2023:
Split of all users by employment type:
Employment Type |
Users |
Relative |
|---|---|---|
Guest professor |
5 |
1.3% |
Professor |
10 |
2.6% |
Administrative/technical staff |
17 |
4.4% |
Non-VUB |
23 |
6.0% |
Student |
97 |
25.3% |
Researcher |
231 |
60.3% |
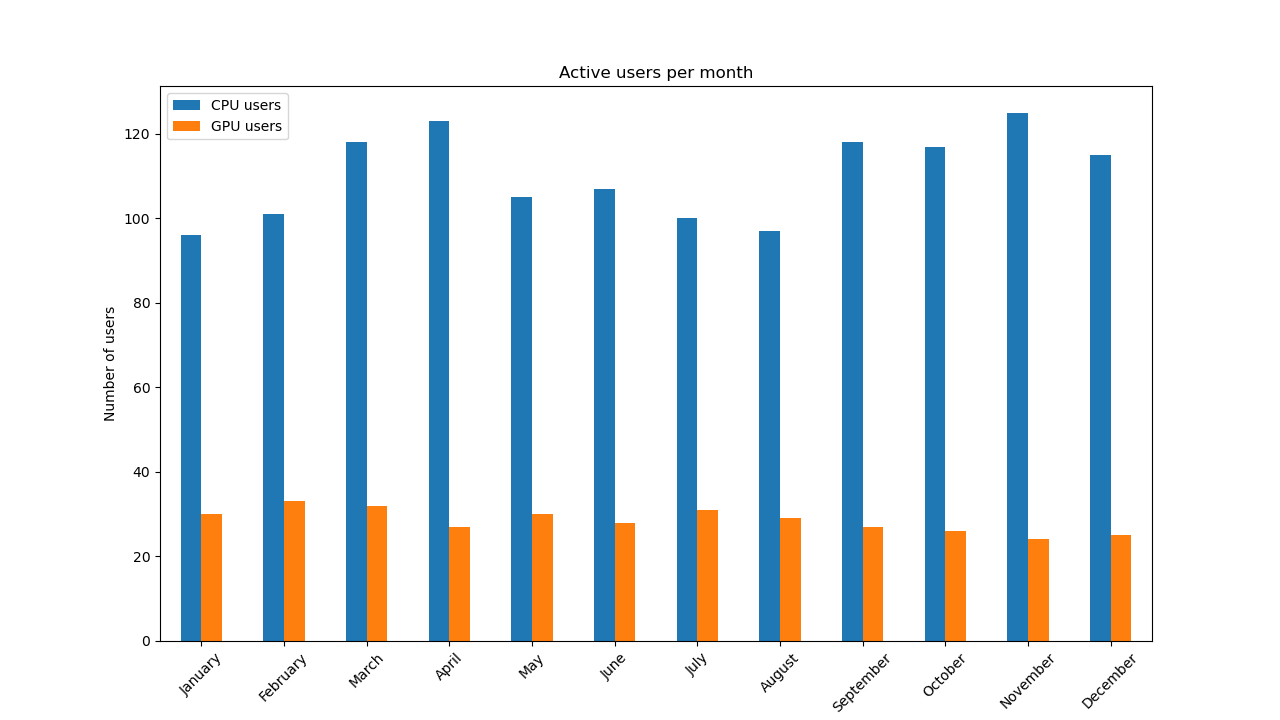
The distribution per month shows the most busy periods of the year:
We saw a larger increase in VSC accounts for VUB on 2024: 237 new accounts were created (compared to 177 on 2023). This increase shows that the effort to recruit more users starts to pay off.
CPU Usage#
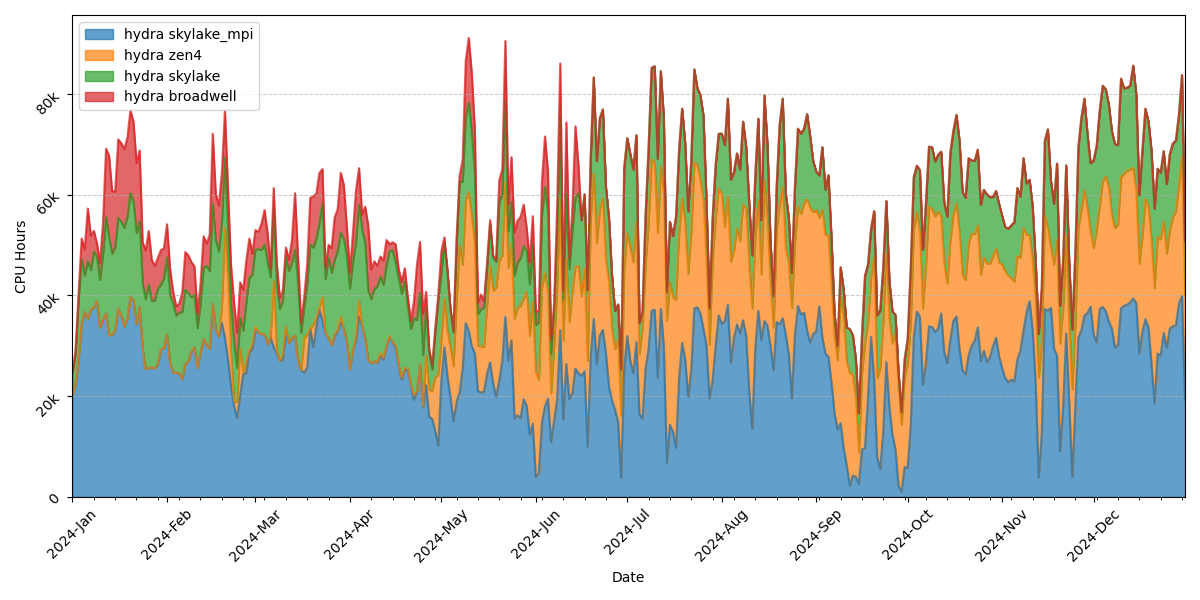
On average, the load on the cluster was 61%. The usage pattern matches that of 2023, i.e. regular large fluctuations in use that fit a weekly cycle.
Tip
Usage on weekends is systematically low, so if you are in rush to get your jobs started quickly that is the best time to do it.
The month of September stands out: usage was low, yet the number of active users was high.
About 80% of the used CPU compute time comes from just 10% of the users.
Split of used CPU compute time per VSC institute:
Institute |
Usage |
|---|---|
VUB |
99.1% |
UAntwerpen |
0.7% |
KULeuven |
0.2% |
UGent |
0.1% |
For the remainder of the analysis we only consider jobs which ran for at least one hour, shorter jobs are assumed to be tests or failed jobs. These jobs represent 98% of the used compute time.
Profile of a typical CPU job split in percentiles of the number of jobs:
Percentile |
Cores |
Nodes |
Walltime |
|---|---|---|---|
0.500 |
1 |
1 |
0 days 04:12:50 |
0.750 |
1 |
1 |
0 days 09:27:37 |
0.800 |
2 |
1 |
0 days 10:13:38 |
0.900 |
8 |
1 |
0 days 14:06:10 |
0.950 |
16 |
1 |
1 days 08:07:08 |
0.990 |
40 |
2 |
3 days 13:17:12 |
0.999 |
128 |
10 |
5 days 00:00:22 |
Note
A typical CPU job (90% of all jobs) runs on a single node, uses 8 or less cores and ends in 14 hours.
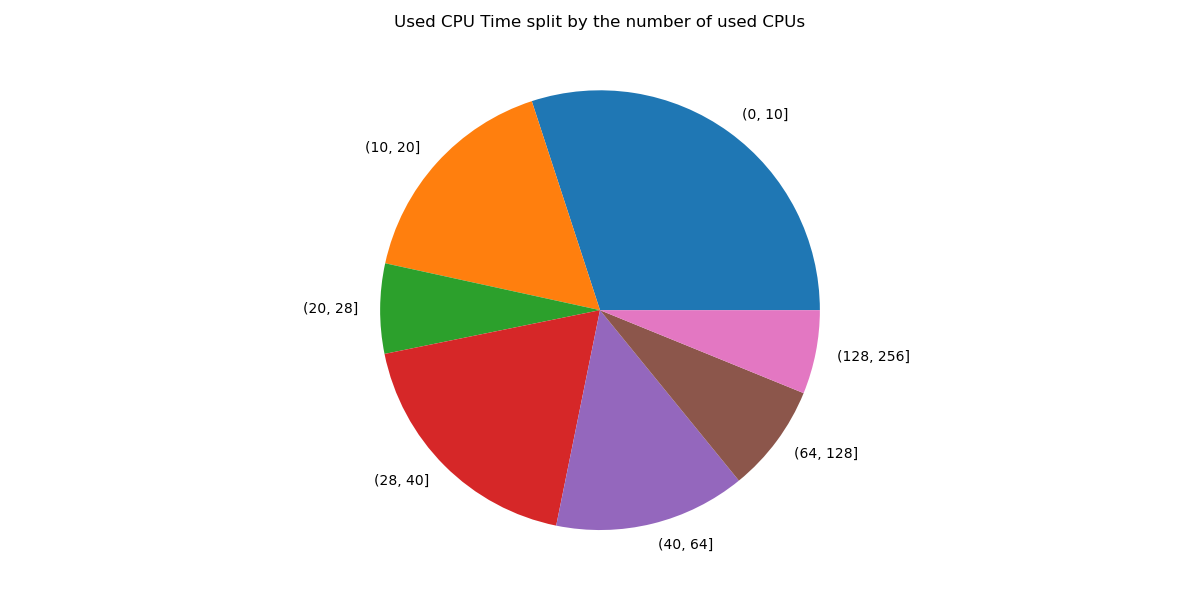
If we look at the number of used cores as function of the used CPU compute time by those jobs, we see that this matches the previous percentiles based on number of jobs:
The number of used nodes as function of the used CPU compute time also matches:
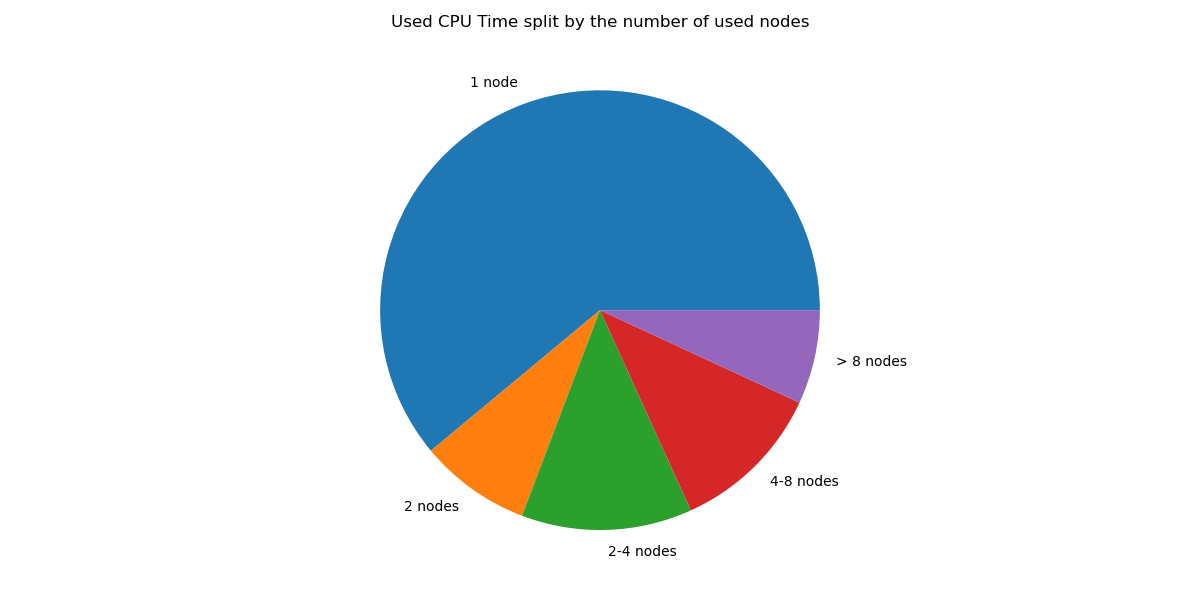
In conclusion:
There were many small jobs: 61% of the jobs ran on a single node and almost 50% on 28 or less cores.
There were many short jobs: 90% ran less than 14 hours, 50% even less than 4 hours.
Compared to 2023 we see that jobs got bigger but the job duration decreased.
As the load in the cluster was not that high, the queuing time for jobs was short for the large majority of jobs (>90%):
Percentile |
Total |
Single core |
Multicore |
Single Node |
Multi Node |
|---|---|---|---|---|---|
0.50 |
0 days 00:00:46 |
0 days 00:00:50 |
0 days 00:00:14 |
0 days 00:00:46 |
0 days 00:23:04 |
0.75 |
0 days 00:27:59 |
0 days 00:07:12 |
0 days 04:07:00 |
0 days 00:24:37 |
0 days 08:52:24 |
0.80 |
0 days 01:32:08 |
0 days 00:53:32 |
0 days 07:36:44 |
0 days 01:27:50 |
0 days 13:06:31 |
0.90 |
0 days 05:06:58 |
0 days 03:43:43 |
0 days 20:03:17 |
0 days 04:58:31 |
1 days 16:03:45 |
0.95 |
0 days 09:17:42 |
0 days 05:48:03 |
1 days 18:23:10 |
0 days 08:43:28 |
3 days 19:03:09 |
0.99 |
1 days 19:29:37 |
0 days 12:08:49 |
5 days 04:22:09 |
1 days 12:20:00 |
6 days 10:52:09 |
The column Total shows the queuing time per percentile for all CPU jobs while the other columns show the queuing time for each type of job.
Queuing time depends on the overall load of the cluster and the resources requested by the job. The more resources requested, the higher the queuing time for that job. However, we see that 50% of all jobs start immediately, regardless of the resources requested. Even including multi-node jobs (the largest), 90% of all jobs start within 5 hours, 80% even within just 1.5 hours.
The previous queuing times are averages for the entire year, which will flat out very busy moments when users can experience much longer queuing times. The following graph splits out queue times on a monthly basis:
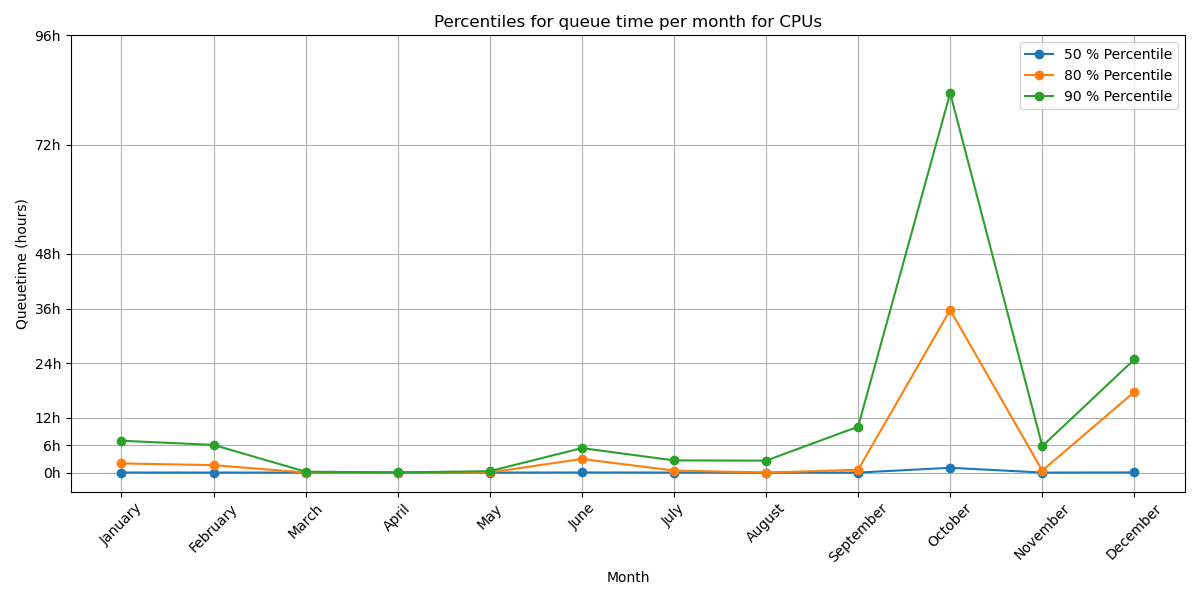
The month of October stands out due to its higher queuing time for the 80% and 90% percentiles. There is no external cause for this though, cluster capacity was nominal, so it was just a busier month than usual.
Due to the large quantity of short jobs submitted to the cluster, we see that the queuing time on Saturday and Sunday is significantly shorter than during the rest of the week (about 50% shorter).
If we look at the active users per month, we see no surprises: April and November are the months with most people on the cluster:
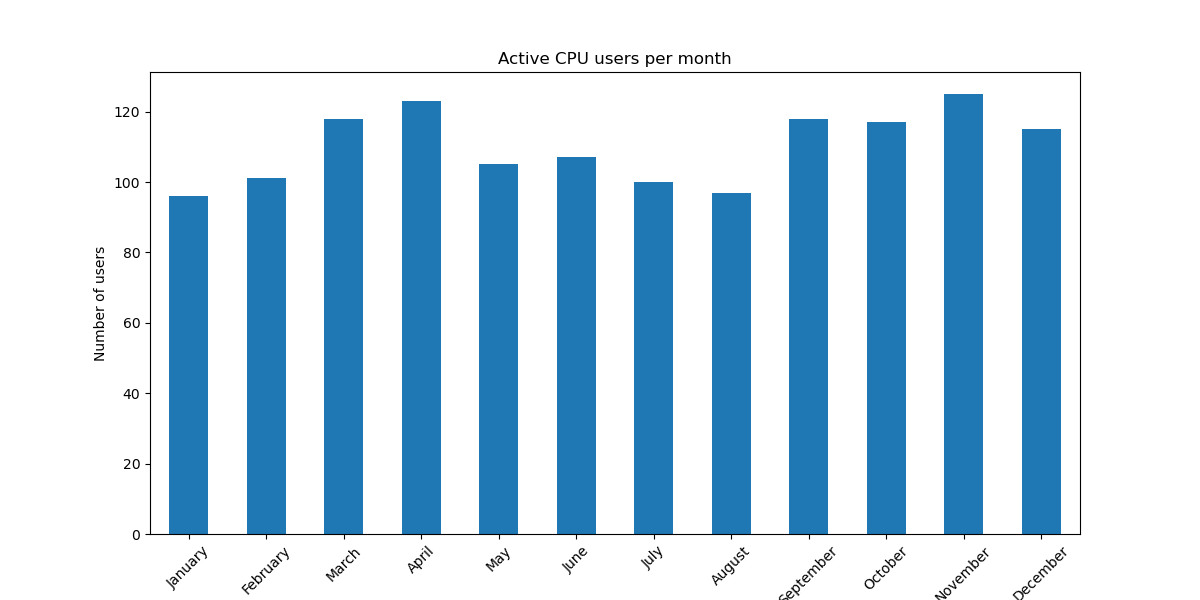
Despite the higher number of users, the queuing time in April does not stand out though.
Used compute time by faculty:
Faculty |
Usage |
|---|---|
Faculty of Social Sciences and Solvay Business School |
0.3% |
Department ICT |
0.8% |
Non-VUB |
0.9% |
Faculty of Medicine and Pharmacy |
1.3% |
students |
14.8% |
Faculty of Engineering |
16.1% |
Faculty of Sciences and Bioengineering Sciences |
65.7% |
We only show those faculties that use at least 0.1% of the total compute time of the year. As expected, the Faculties of Sciences and (Bio-)Engineering use the largest share of the CPU compute time.
The overview of used compute time per department reveals the actual use of the cluster per scientific domain:
Department |
Usage |
|---|---|
Electronics and Informatics |
0.1% |
Supporting clinical sciences |
0.2% |
Sociology |
0.2% |
Clinical sciences |
0.3% |
Department of Bio-engineering Sciences |
0.5% |
Pharmaceutical and Pharmacological Sciences |
0.7% |
Administrative Information Processing |
0.8% |
Non-VUB |
0.9% |
Electrical Engineering and Power Electronics |
1.0% |
Applied Physics and Photonics |
1.1% |
Engineering Technology |
1.2% |
Department of Water and Climate |
2.4% |
Biology |
2.7% |
Geography |
3.1% |
Applied Mechanics |
4.8% |
Materials and Chemistry |
5.5% |
Physics |
5.6% |
Informatics and Applied Informatics |
14.4% |
students |
14.8% |
Chemistry |
39.4% |
Used compute time split over the different employment types of the users:
Employment Type |
Usage |
|---|---|
Guest professor |
0.5% |
Non-VUB |
0.9% |
Professor |
1.5% |
Administrative/technical staff |
6.0% |
Students |
14.7% |
Researcher |
76.3% |
GPU Usage#
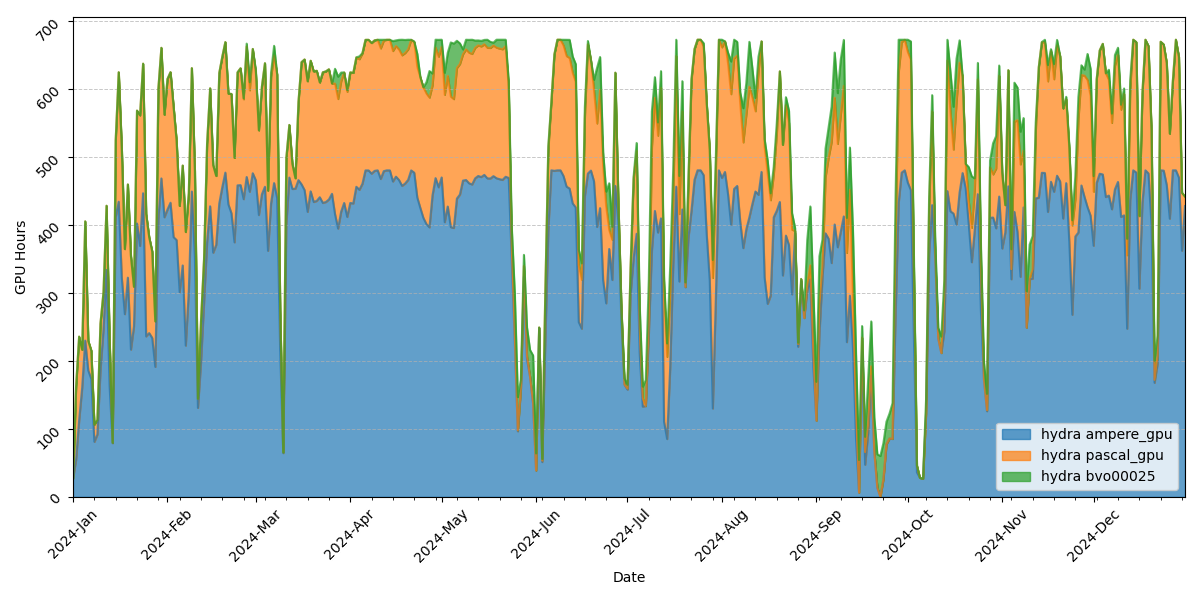
The load on the GPUs of the cluster was 75% on average, with some periods during the year of low usage during and others where all GPUs were constantly in use.
About 80% of the used GPU time comes from just 10% of the users. Similarly to what we see on CPUs.
Split of used GPU time per VSC institute:
Institute |
Usage |
|---|---|
VUB |
97.4% |
UAntwerpen |
0.0% |
KULeuven |
2.5% |
UGent |
0.1% |
For the remainder of the analysis we only consider jobs which ran for at least one hour, shorter jobs are assumed to be tests or failed jobs. These jobs represent 96.5% of the used GPU time.
Profile of a typical GPU job split in percentiles of the number of jobs:
Percentile |
GPUs |
Nodes |
Walltime |
|---|---|---|---|
0.500 |
1 |
1 |
0 days 05:11:24 |
0.750 |
1 |
1 |
0 days 10:39:58 |
0.800 |
1 |
1 |
0 days 13:05:19 |
0.900 |
1 |
1 |
1 days 00:00:09 |
0.950 |
1 |
1 |
1 days 12:00:13 |
0.990 |
2 |
1 |
4 days 04:20:02 |
0.999 |
3 |
3 |
5 days 00:00:19 |
Note
A typical GPU job (90% of all jobs) uses a single GPU and runs for less than 1 day.
If you look at the number of GPUs used as function of the used GPU time by those jobs, we see that this matches the previous percentiles based on number of jobs:
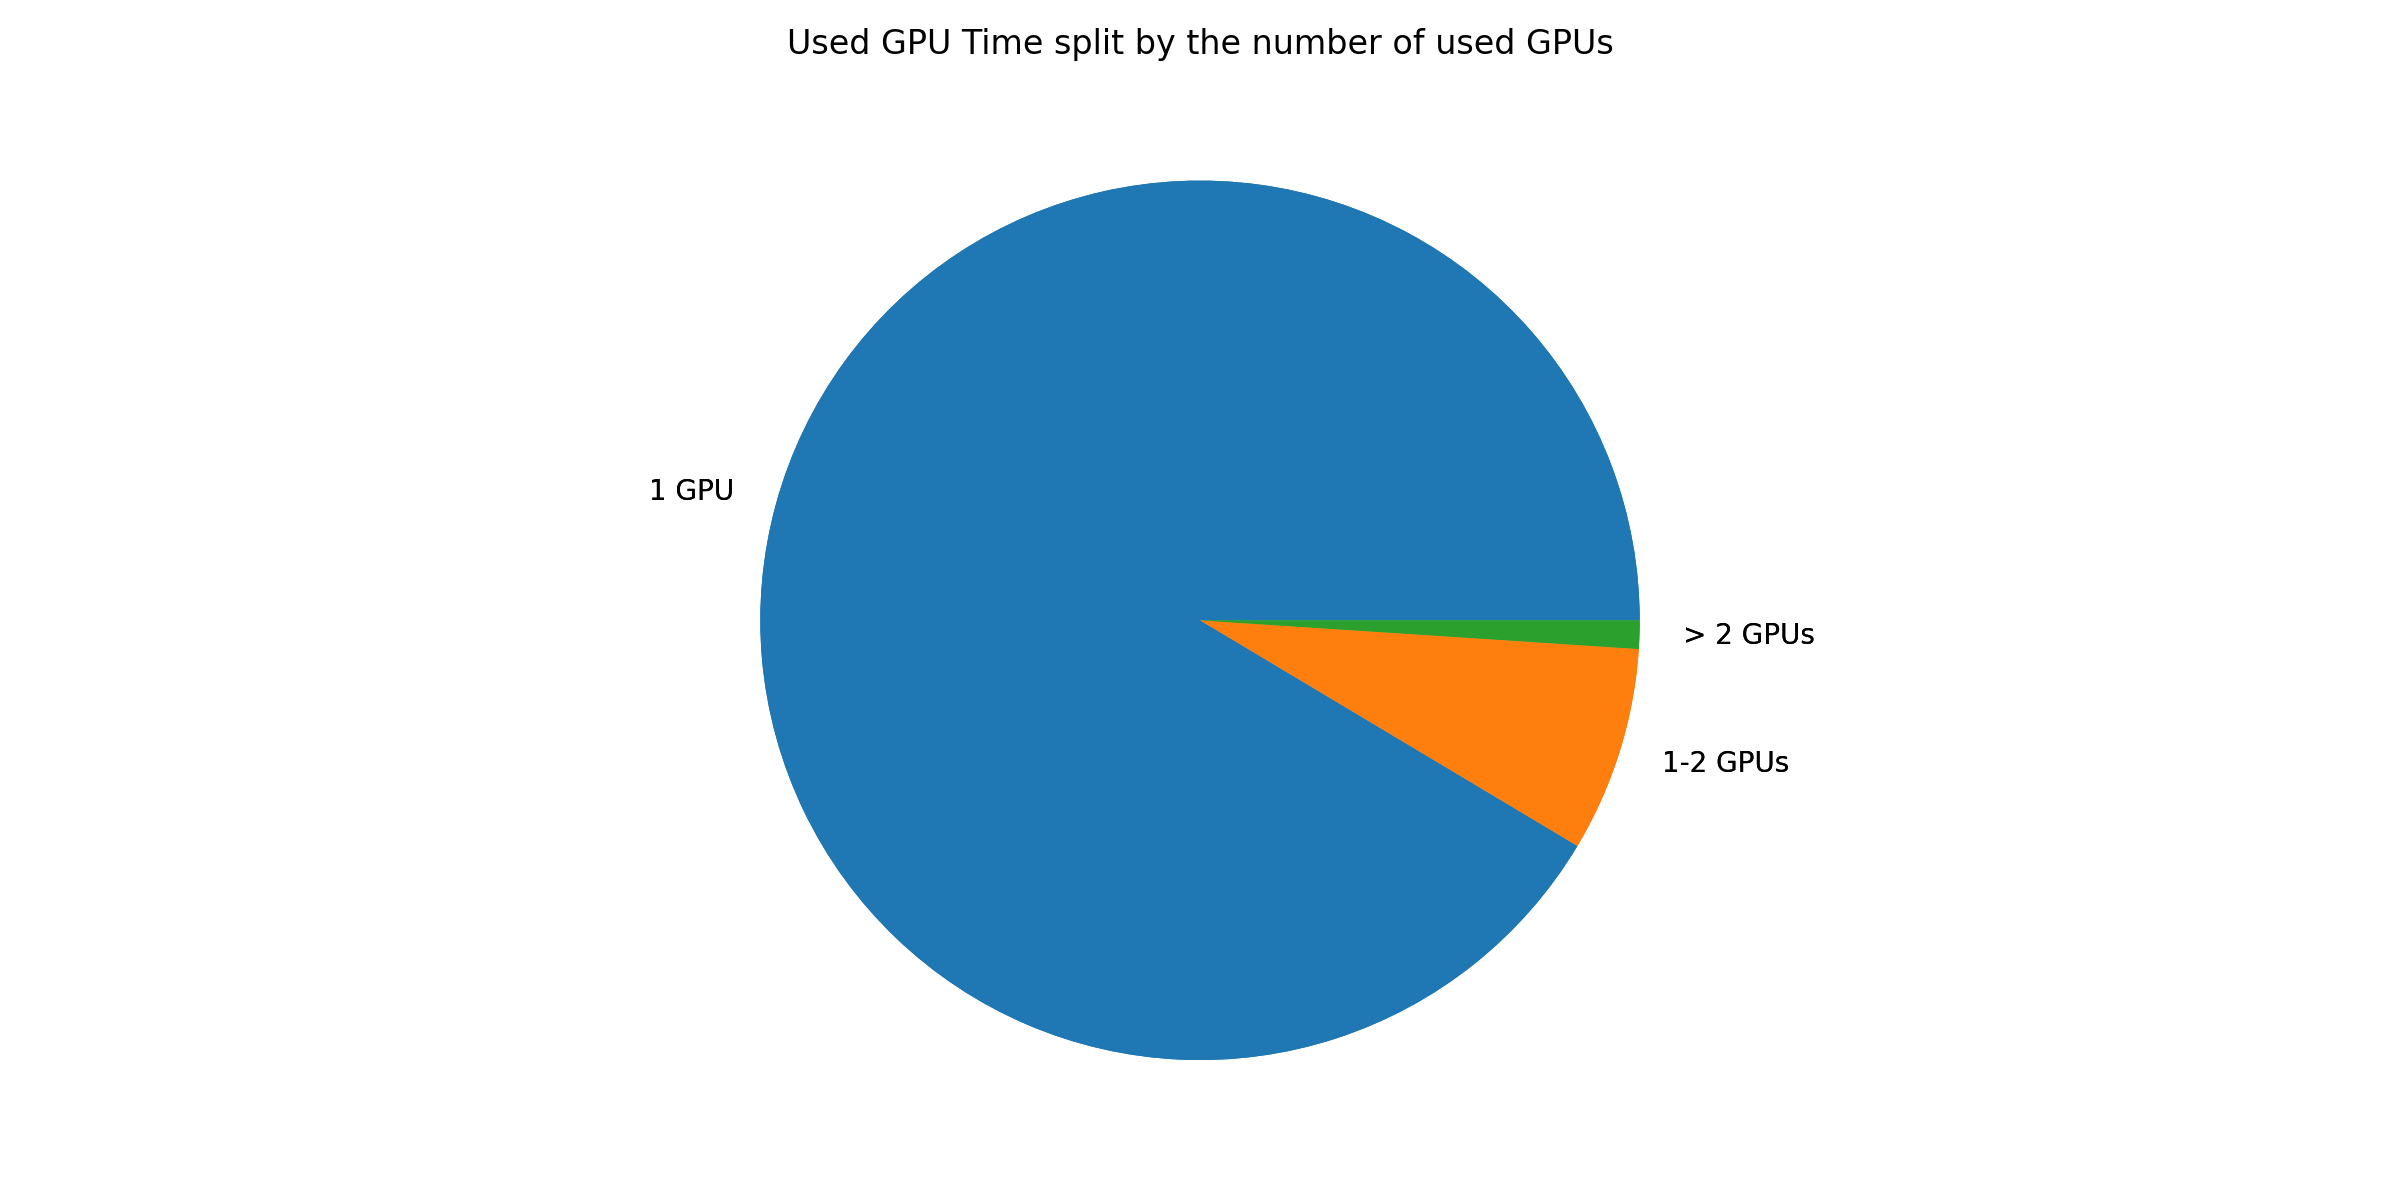
In conclusion:
The large majority of GPU jobs (91%) uses a single GPU
There are many short GPU jobs: 80% of jobs run for less than 13 hours, 50% for less than 5.2 hours
Compared to 2023, the dominance of single GPU jobs has increased while the job duration has decreased.
The number of GPU resources in Hydra is a lot smaller than its CPU resources, which is reflected on the longer queuing time observed on GPUs. Moreover, we see a general uptake in the use of AI/ML techniques and thus an increasing demand for GPU resources.
Percentile |
Total |
Single GPU |
Multi GPU |
|---|---|---|---|
0.500 |
0 days 03:16:24 |
0 days 03:23:54 |
0 days 00:15:46 |
0.750 |
0 days 11:43:20 |
0 days 11:54:03 |
0 days 05:59:34 |
0.800 |
0 days 14:40:07 |
0 days 14:47:51 |
0 days 08:52:30 |
0.900 |
0 days 23:56:34 |
0 days 23:59:24 |
0 days 19:09:27 |
0.950 |
1 days 10:24:31 |
1 days 10:28:22 |
1 days 07:31:23 |
0.990 |
3 days 00:40:18 |
3 days 03:53:17 |
2 days 10:01:51 |
0.999 |
14 days 05:49:23 |
14 days 06:19:27 |
5 days 00:17:31 |
The column Total shows the queuing time per percentile for all GPU jobs while the other columns show the queuing time for each type of job.
The load on the GPU nodes was a lot higher compared to 2023 and this translates into longer queue times. Nonetheless, 50% of GPU jobs start within a couple of hours from launch and 90% start within a day.
The previous queuing times are averages for the entire year, which will flat out very busy moments when users can experience much longer queuing times. The following graph splits out queue times on a monthly basis:
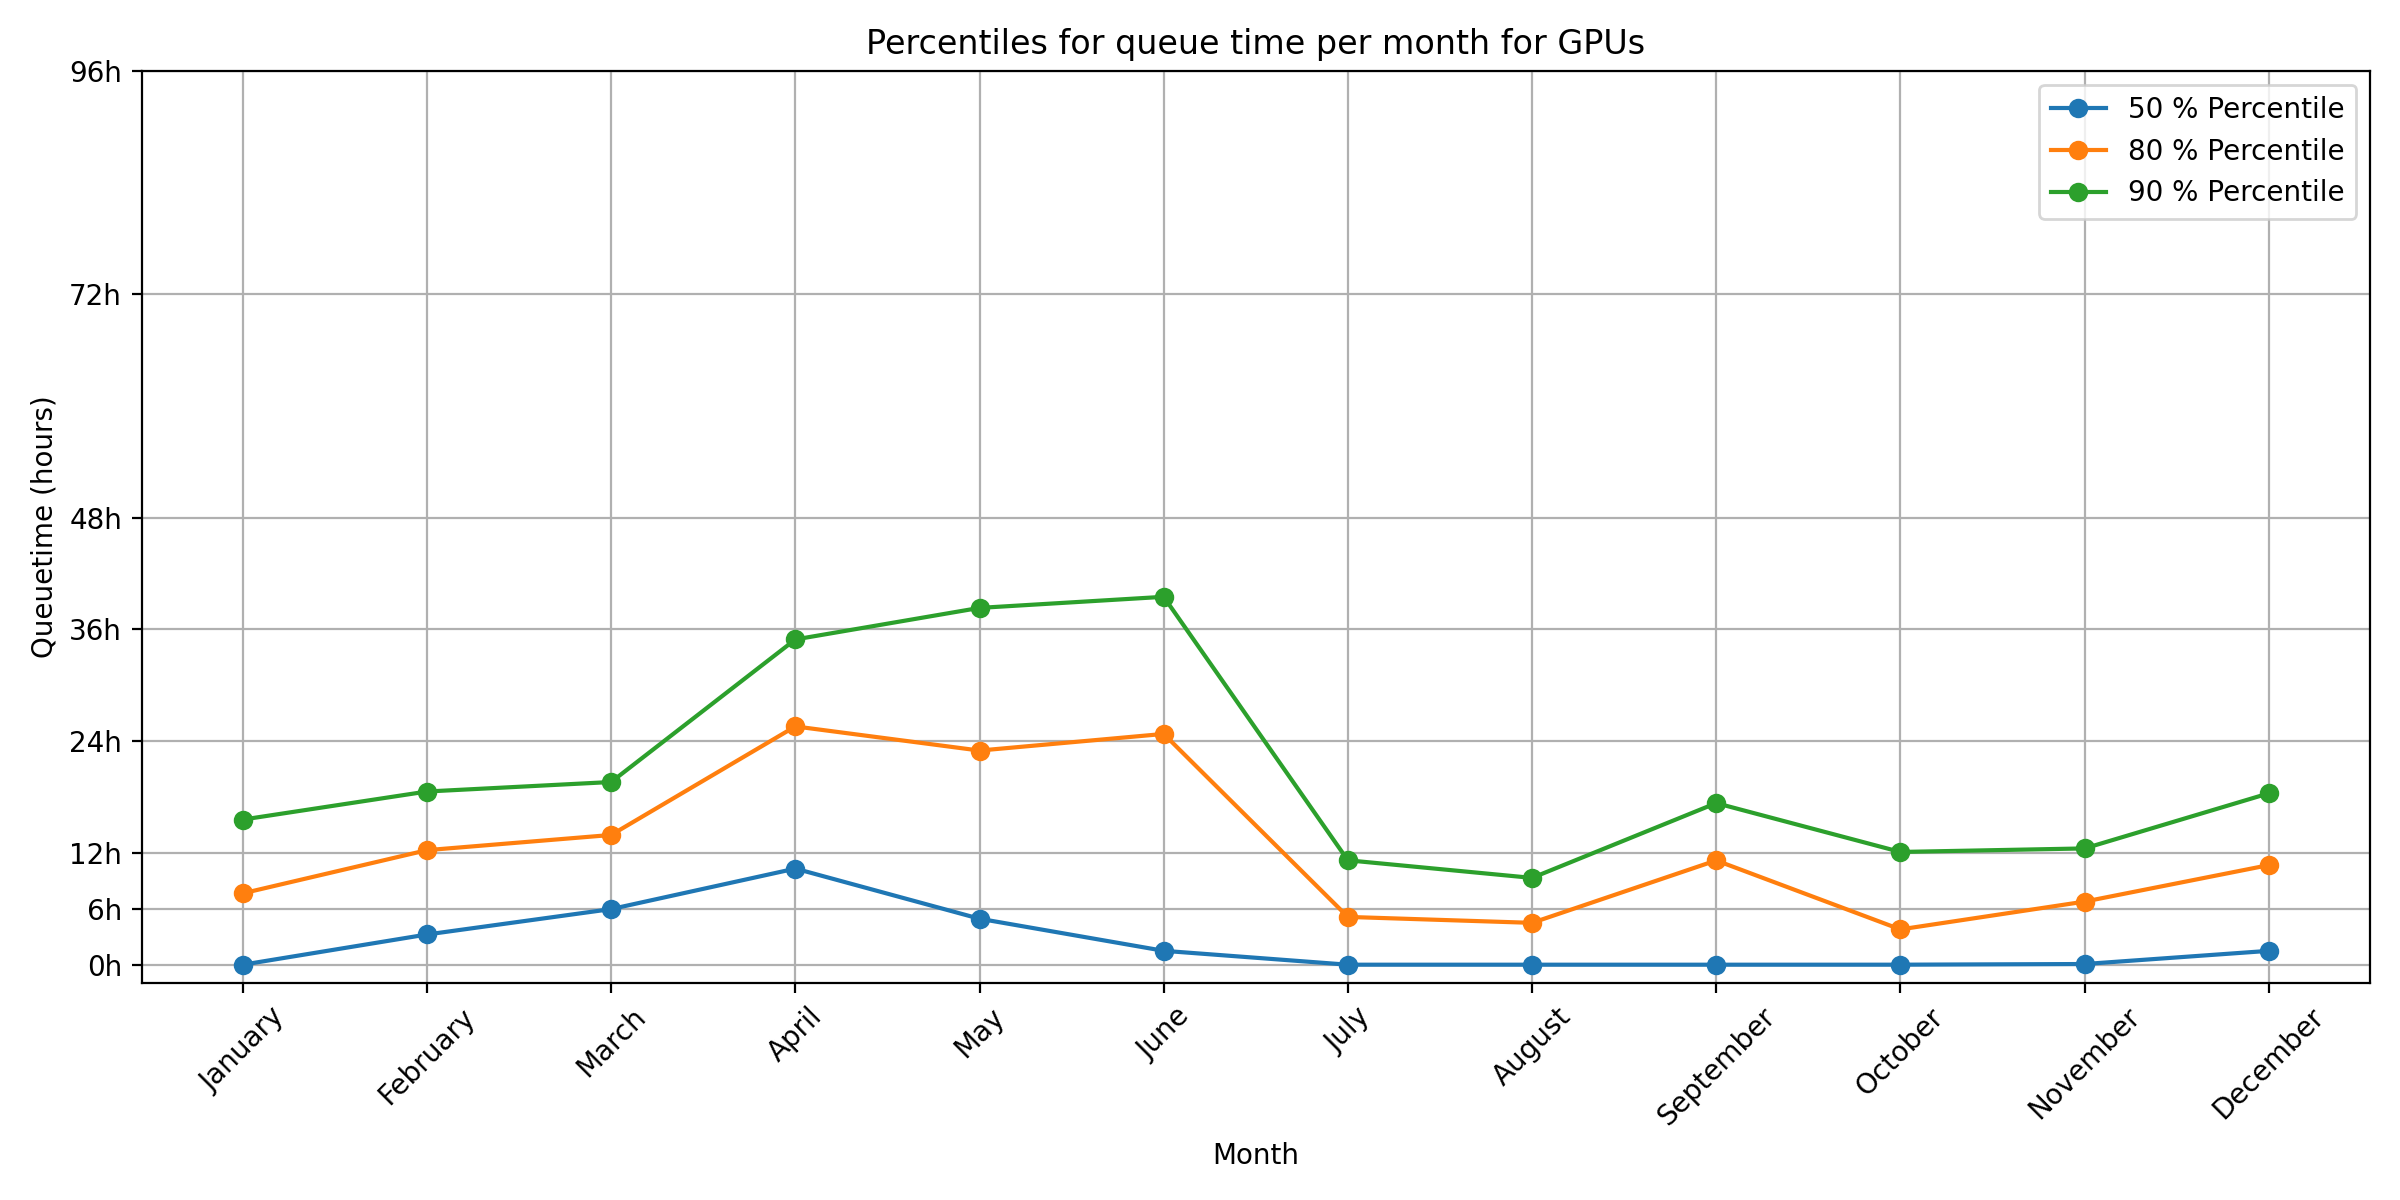
As expected, during the busy periods on the cluster, the queuing time is higher but on average the 50% percentile queue time is still low.
As in 2023, and unlike for CPU jobs, we don’t clearly see a weekend effect in the queuing time of GPUs.
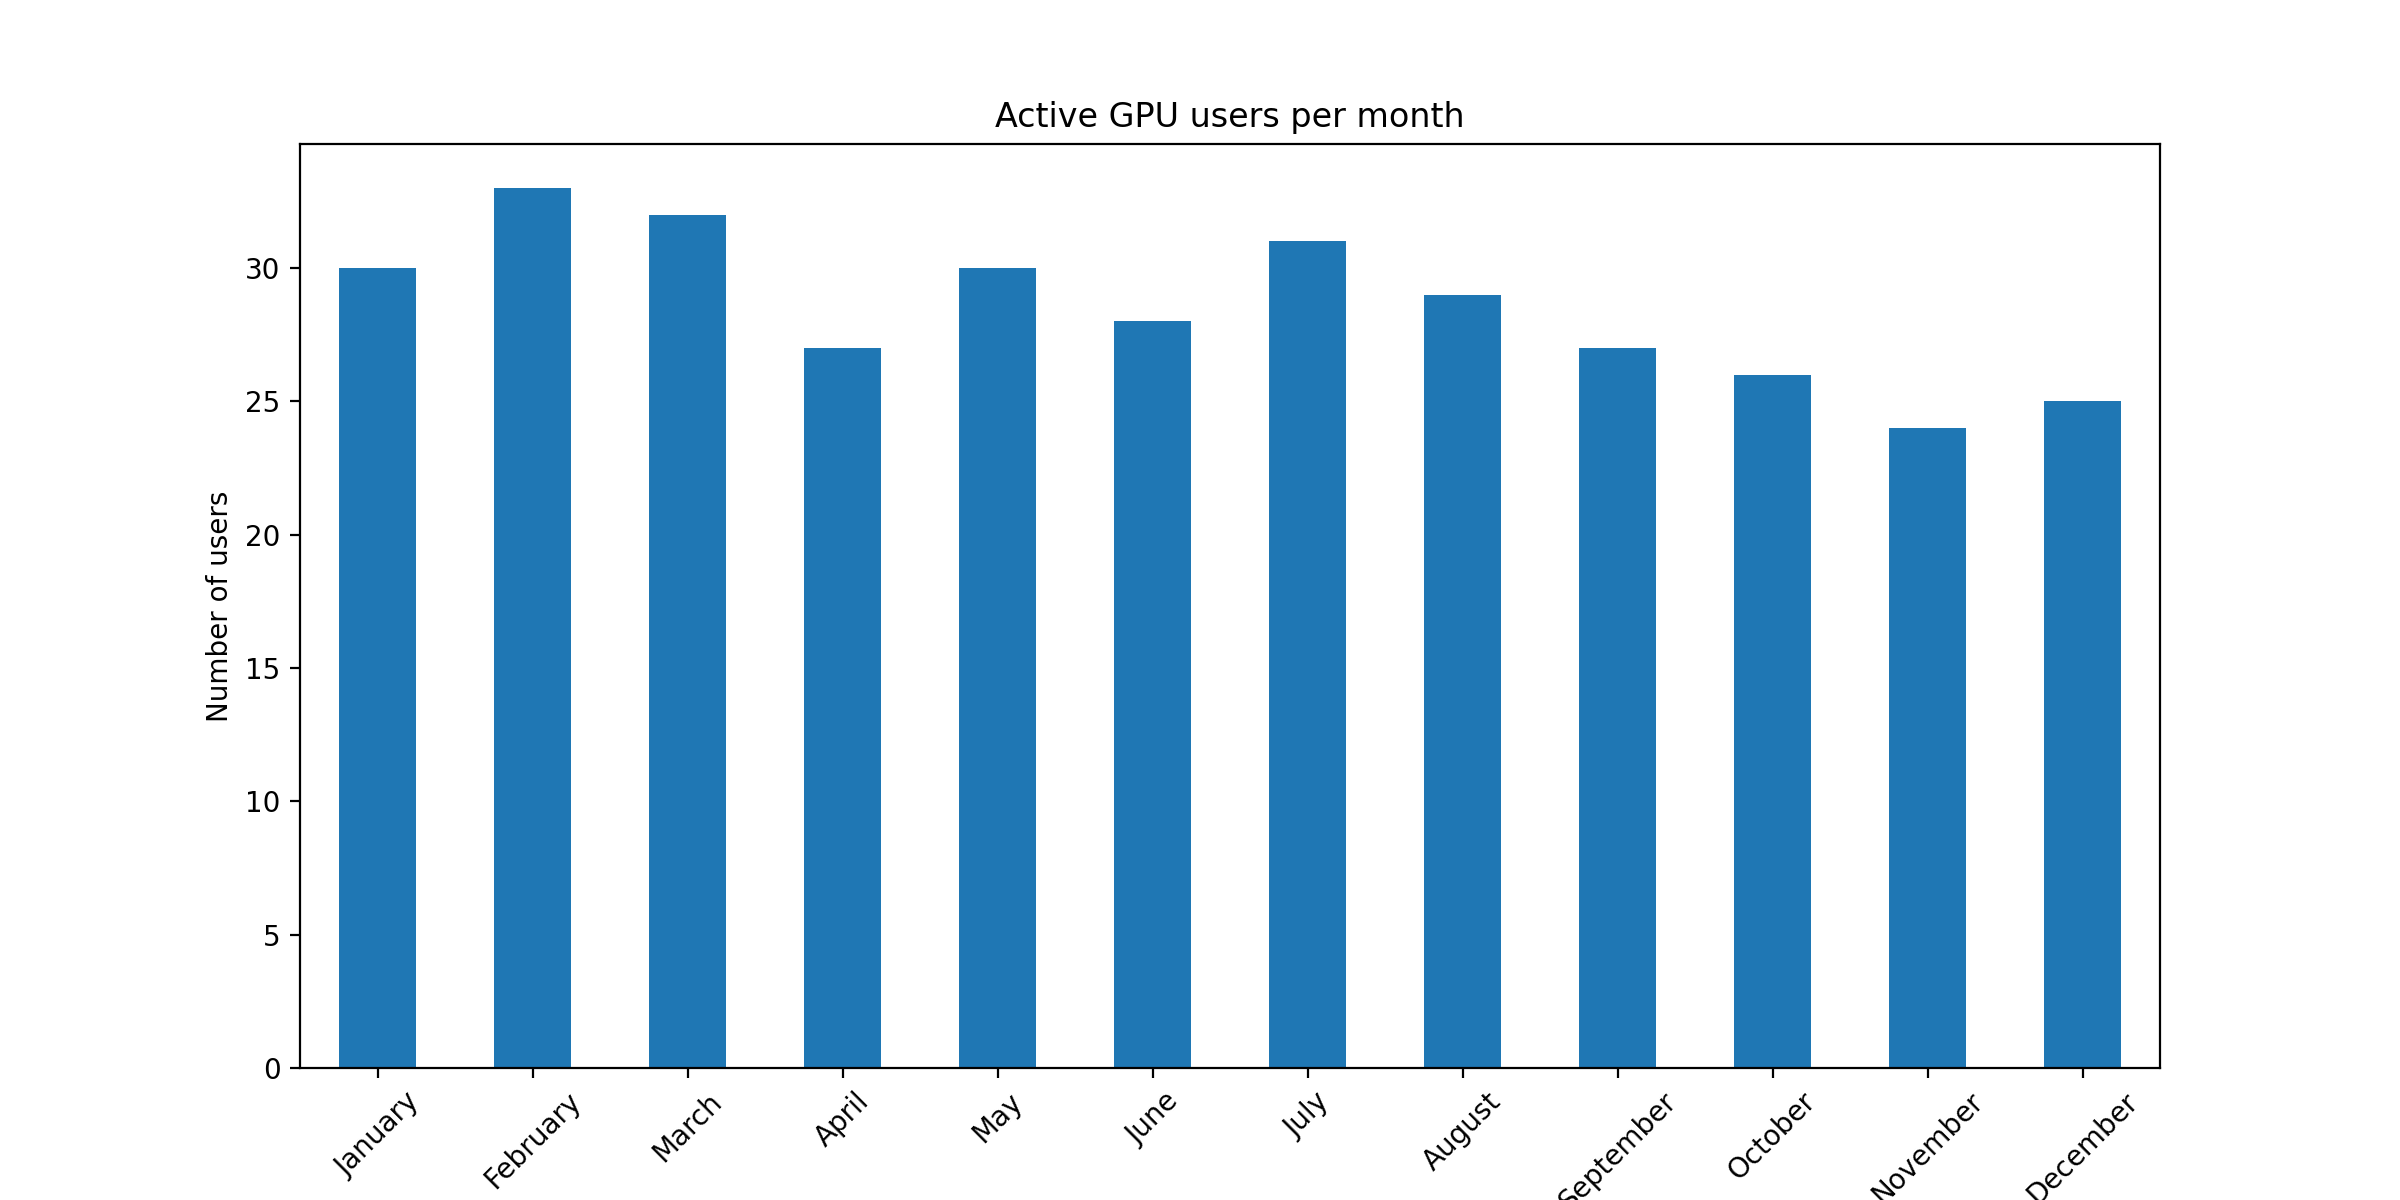
Looking at the active users per month, we see that the second part of the year had less active GPU users:
Used GPU time by faculty:
Faculty |
Usage |
|---|---|
Department ICT |
1.5% |
non-VUB |
2.7% |
Faculty of Medicine and Pharmacy |
7.7% |
Faculty of Social Sciences and Solvay Business School |
15.9% |
Faculty of Engineering |
19.0% |
students |
22.0% |
Faculty of Sciences and Bioengineering Sciences |
31.3% |
We only show those faculties that use at least 0.1% of total compute time. Here we can clearly see the growing importance of AI/ML in all domains of science. The medical and social sciences are small users of the CPU resources but big users of the GPU resources, like in 2023.
The overview of used compute time per department reveals the actual use of the GPUs per scientific domain:
Department |
Usage |
|---|---|
Chemistry |
0.1% |
Basic (bio-) Medical Sciences |
0.1% |
Geography |
0.1% |
Applied Physics and Photonics |
0.4% |
WIDSWE |
0.8% |
Department of Water and Climate |
1.0% |
Electrical Engineering and Power Electronics |
1.2% |
Administrative Information Processing |
1.5% |
Engineering Technology |
1.7% |
non-VUB |
2.7% |
Pharmaceutical and Pharmacological Sciences |
7.5% |
Department of Bio-engineering Sciences |
13.8% |
Electronics and Informatics |
14.7% |
Business technology and Operations |
15.9% |
Informatics and Applied Informatics |
16.5% |
students |
22.0% |
Used compute time split over the different types of personnel:
Employment Type |
relative |
|---|---|
Professor |
0.2% |
Administrative/technical staff |
1.5% |
non-VUB |
2.7% |
students |
21.9% |
Researcher |
73.8% |
Software Usage#
In 2024, there were 5,694 modules available across all the partitions of Hydra which represent 1,137 unique software installations and 3,482 unique extensions. The following chart shows the most used software by users based on modules loaded directly on the terminal or in their jobs.
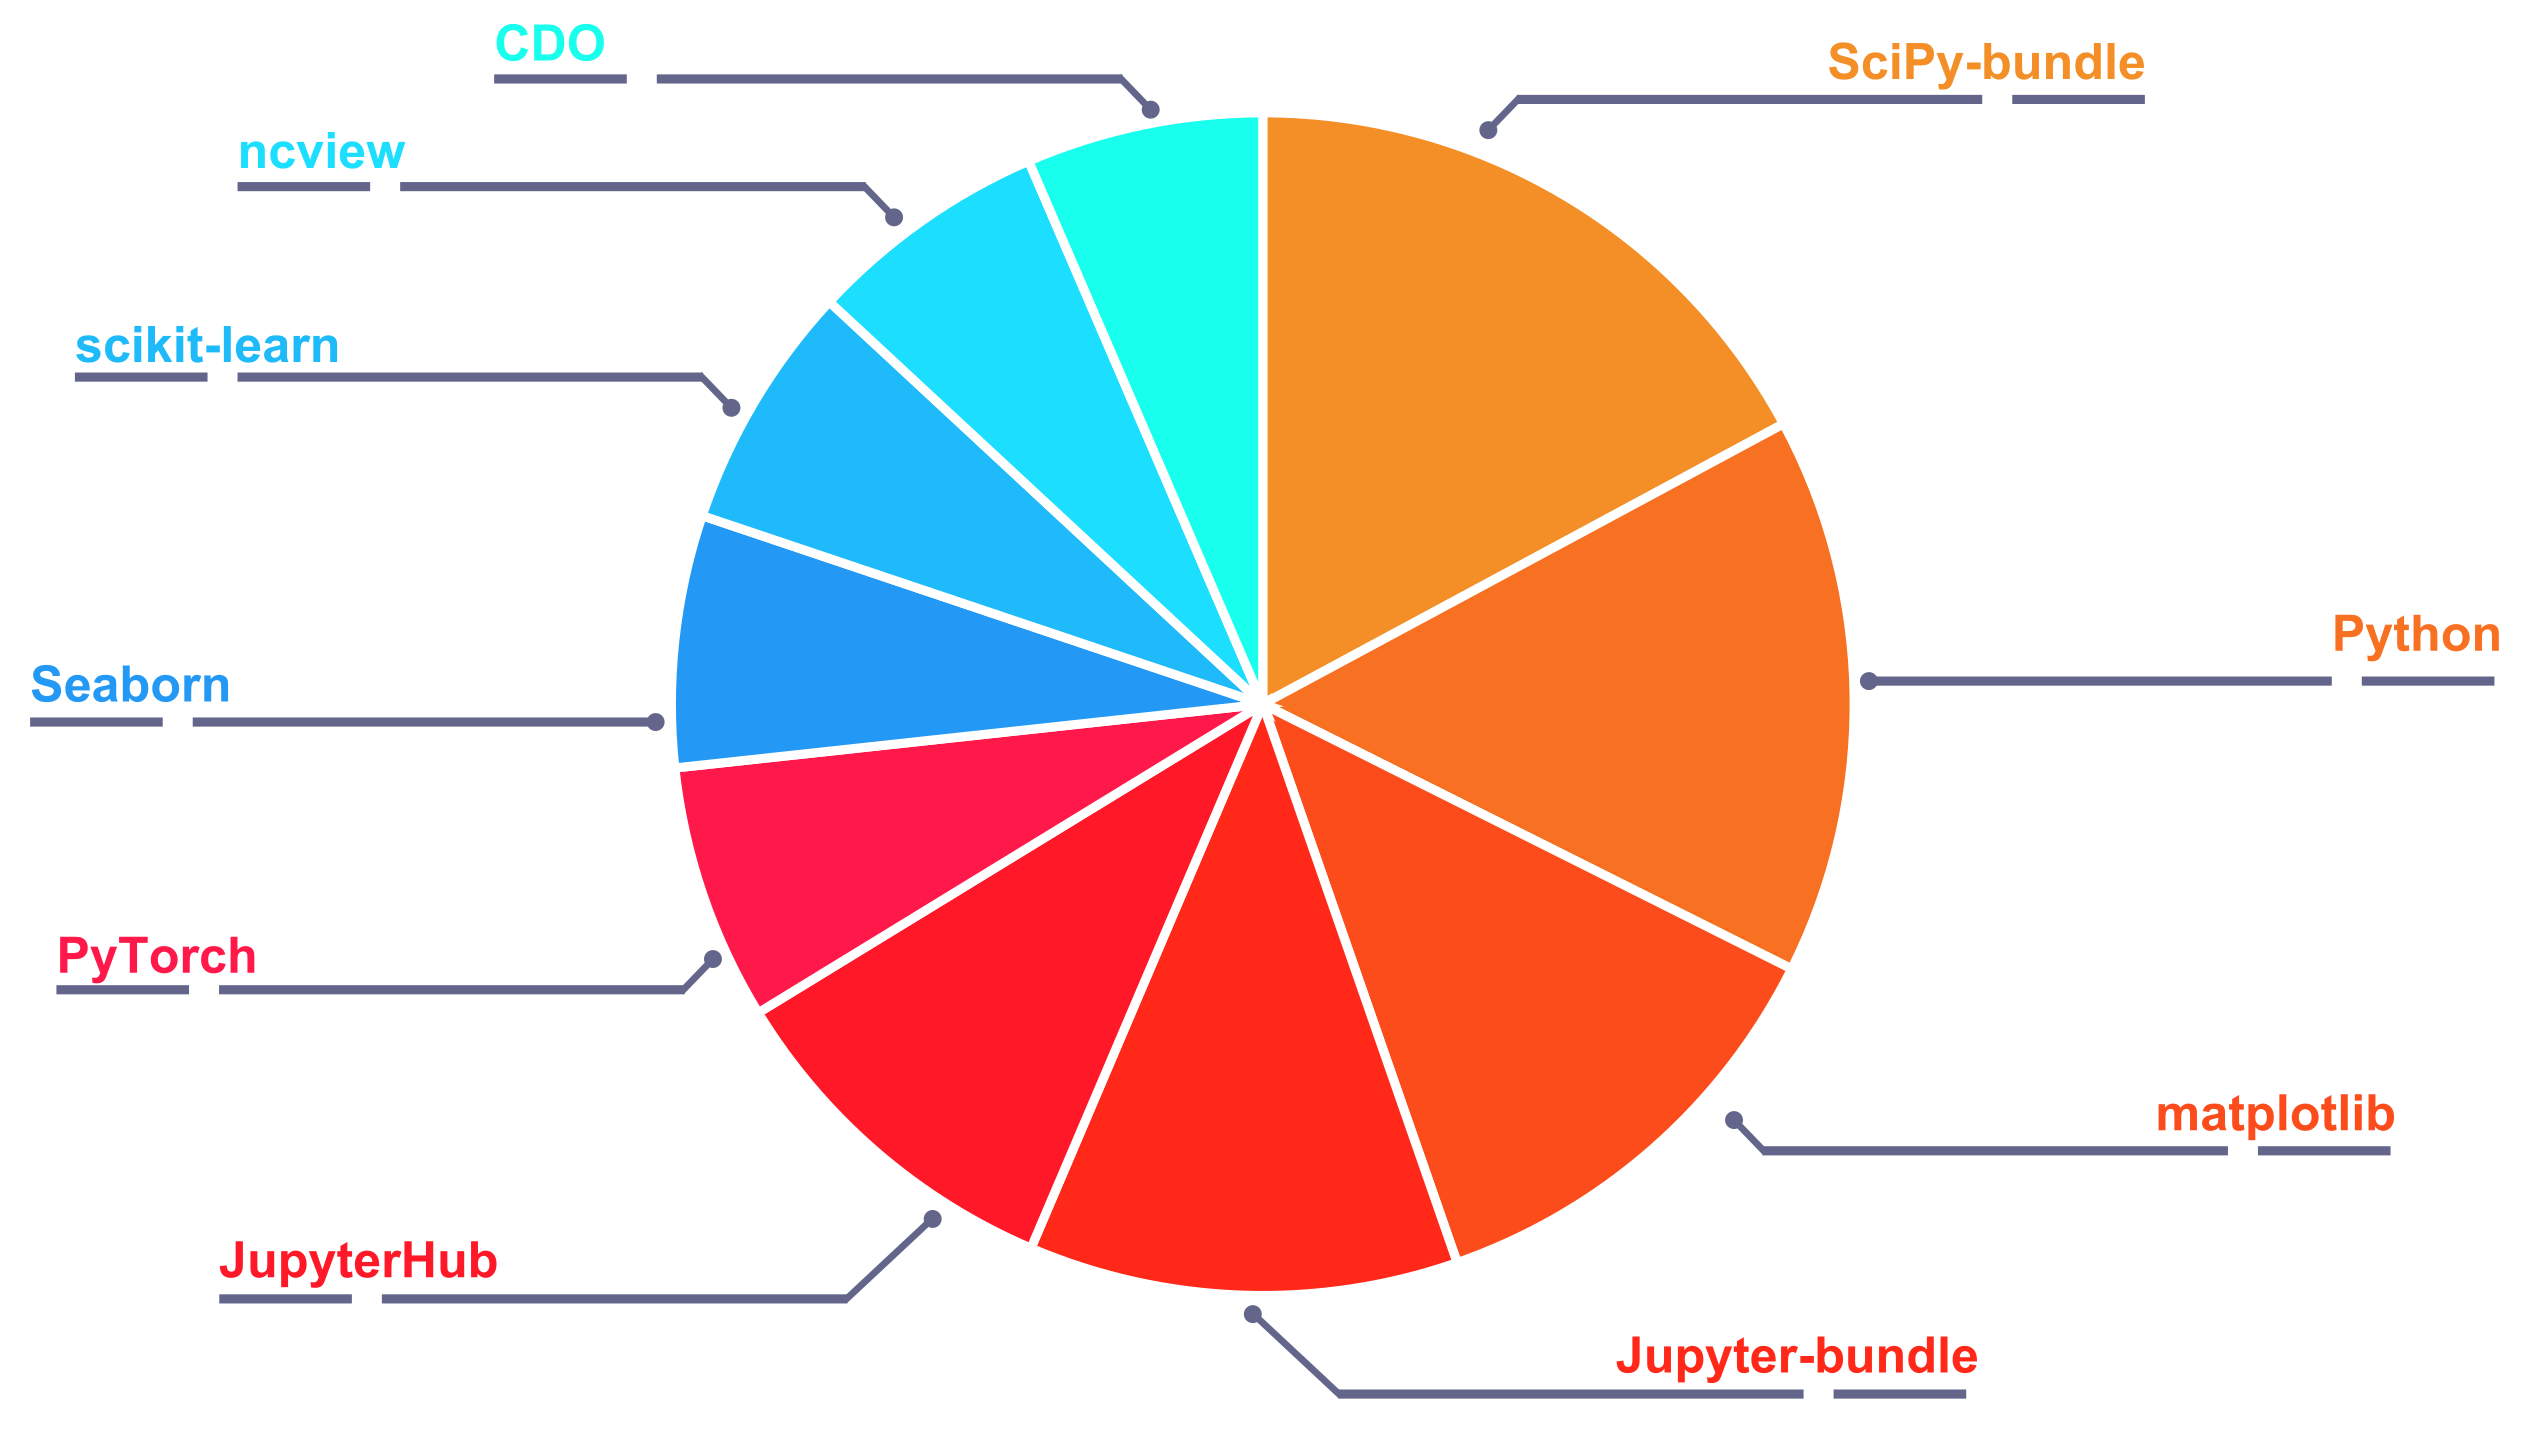
Unsurprisingly, Python rules: the top 5 software modules are all packages in the Python ecosystem.
Notebook Usage#
The HPC notebook platform launched in 2023 consolidated itself in 2024 as a major portal to access Hydra by our users.
In total, 5509 sessions were started in 2024 on notebooks.hpc.vub.be. This is equivalent to roughly 15 users on the notebook platform every single day, double of what we saw in 2023.
Usage of the Jupyter environment:
Notebook Environment |
Sessions |
Percentage |
|---|---|---|
Default: minimal with all modules available |
4012 |
72.8% |
DataScience: SciPy-bundle + matplotlib + dask |
1083 |
19.7% |
Molecules: DataScience + nglview + 3Dmol |
89 |
1.6% |
RStudio with R |
206 |
3.7% |
MATLAB |
119 |
2.2% |
The star of the notebook platform are the tools for Python, as we also see in the usage of regular software modules. The DataScience environment gathers a fifth of all loads, while most users prefer launching the Default environment and manually loading their own software modules.
User support#
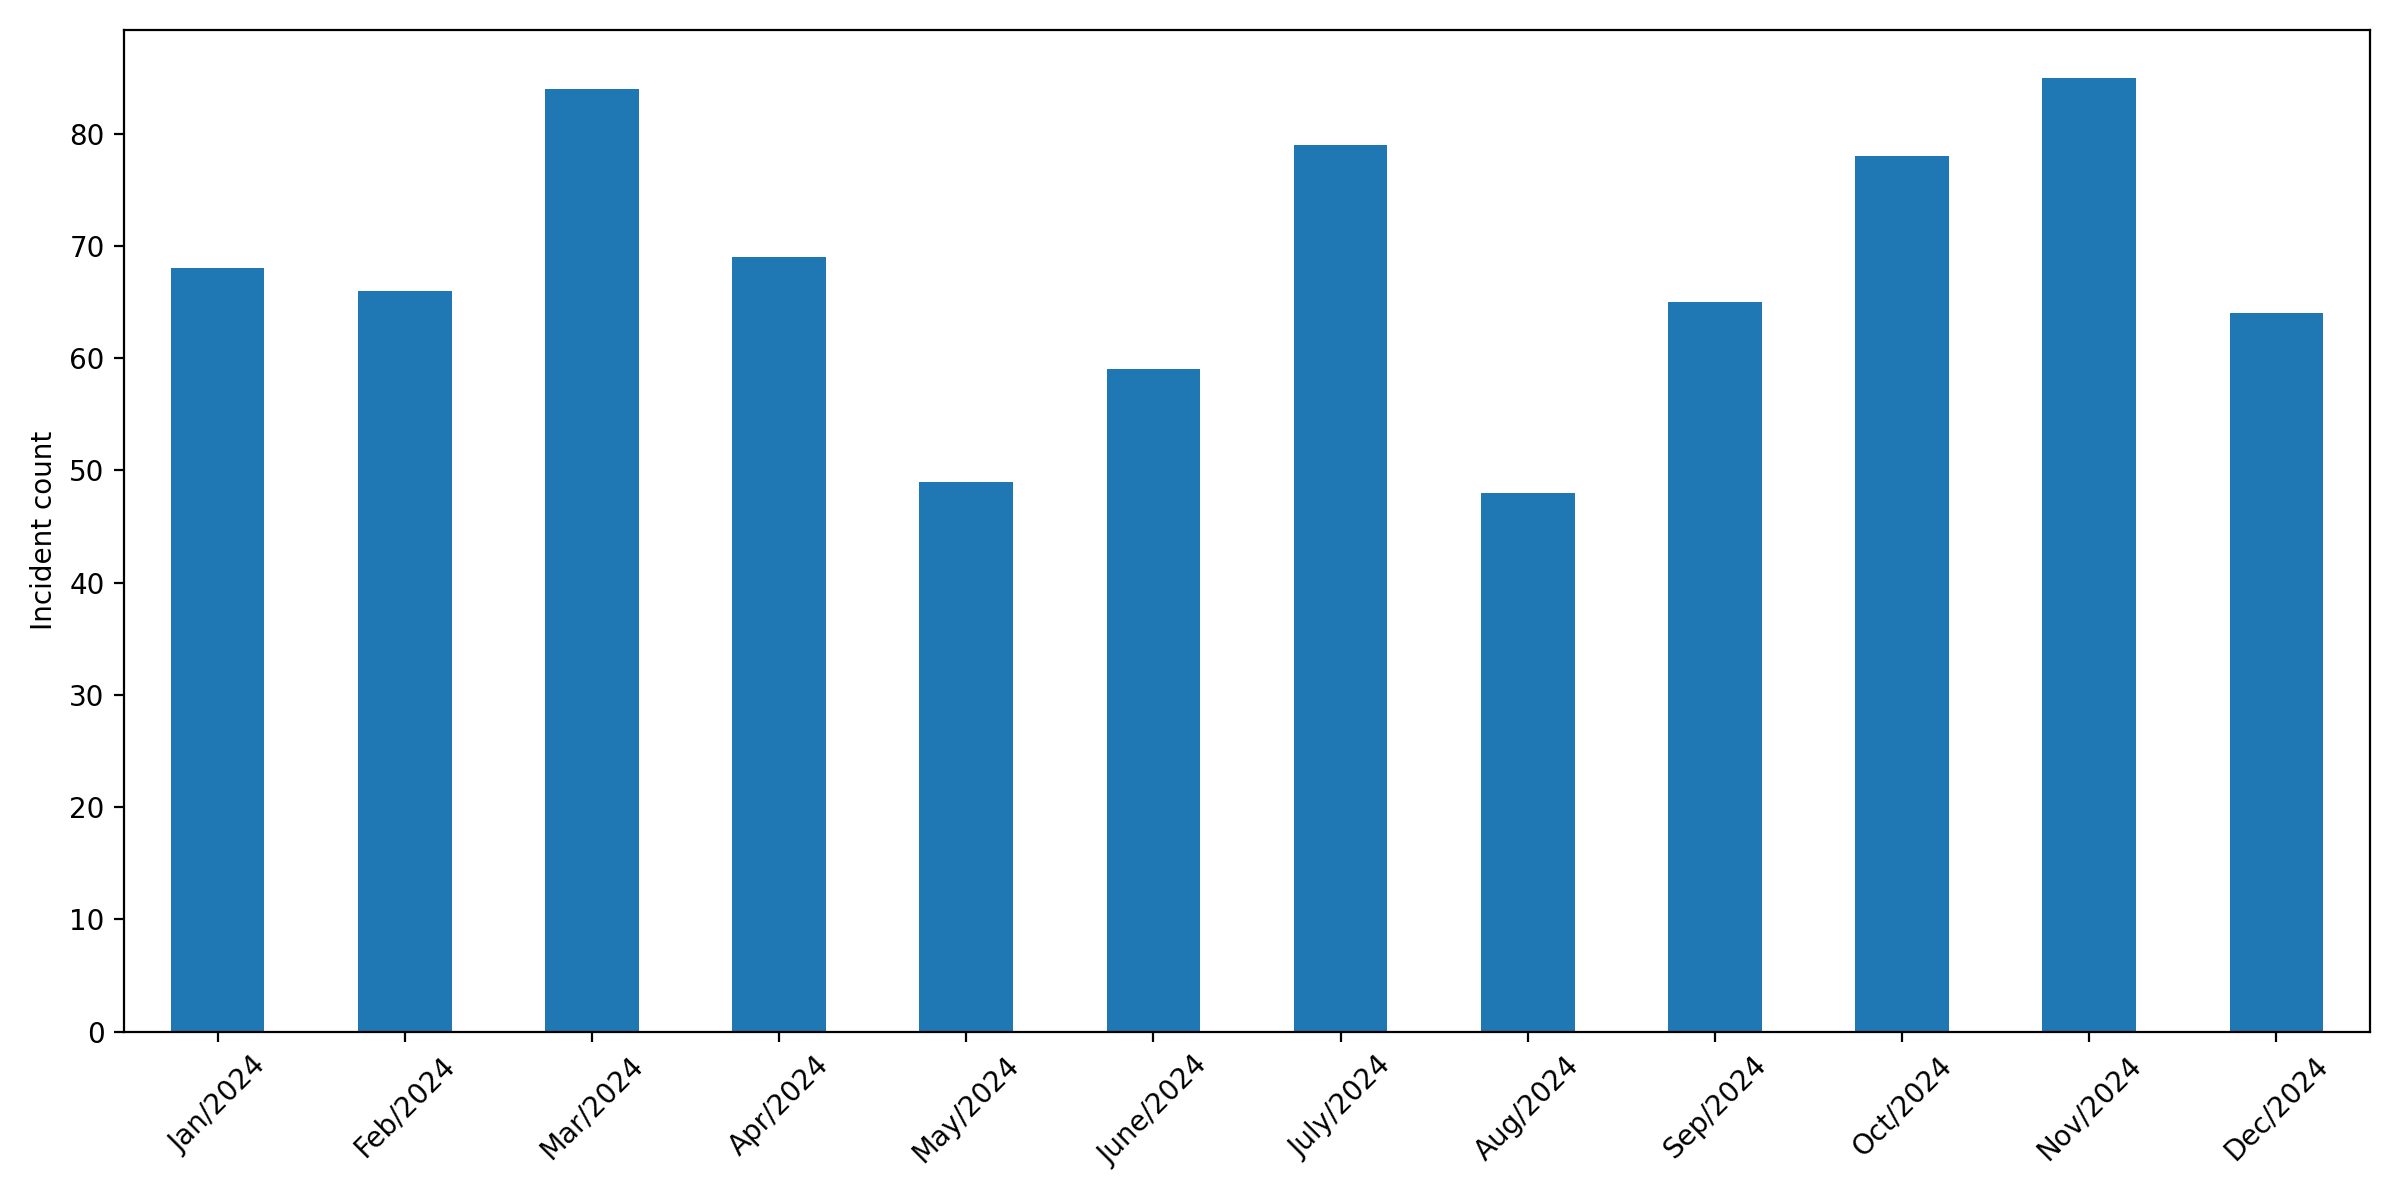
We received 814 support requests (incidents) from users, which is a substantial increase compared to 2023 where there were 714 support requests. Distribution per month follows the academic year and the load on the system:
Distribution per service provided by the SDC team:
Business service |
Incident Count |
Percentage of Incidents |
|---|---|---|
HPC Scientific software installation |
215 |
27.0% |
HPC jobs troubleshooting |
166 |
20.8% |
HPC data |
116 |
14.6% |
HPC consultancy |
96 |
12.0% |
Pixiu scientific research data |
91 |
11.4% |
HPC VSC accounts & access |
80 |
10.0% |
HPC Tier-0 & Tier-1 projects advice |
32 |
4.0% |
HPC Tier-2 hardware co-investment |
1 |
0.1% |
The majority of incidents (~48%) are related to problems with jobs or requests for new software installations.
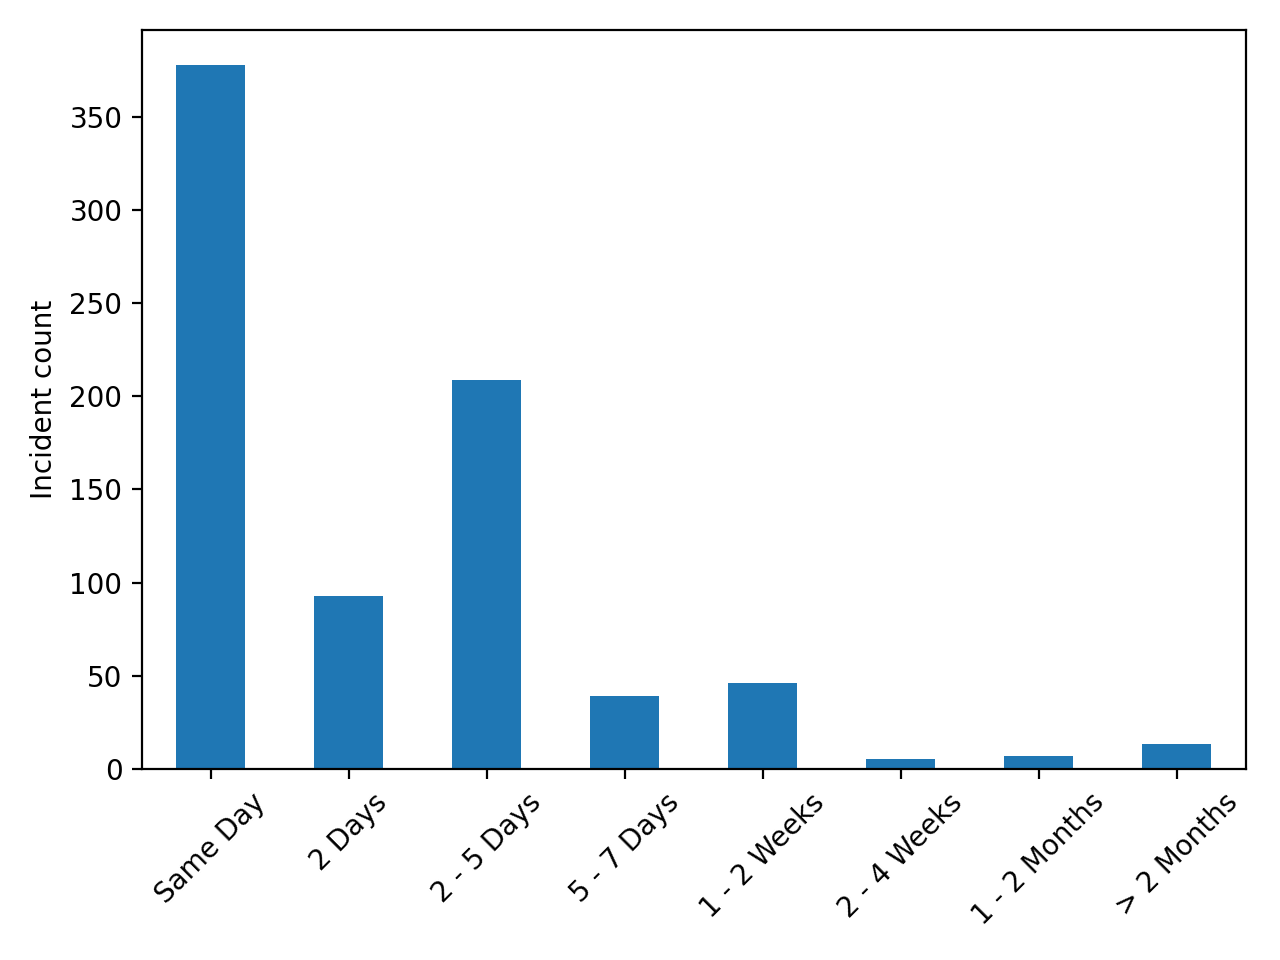
We managed to resolve the large majority of the incidents within one work day:
Tier-1#
There were 3 calls for projects in 2024 for VSC Tier-1 (Hortense). In total 24 starting grants were requested by VUB researchers and 11 full projects were submitted to those 3 calls: 9 of those submissions were accepted, which translates into a 82% success rate.
Usage of CPU Hortense in 2024:
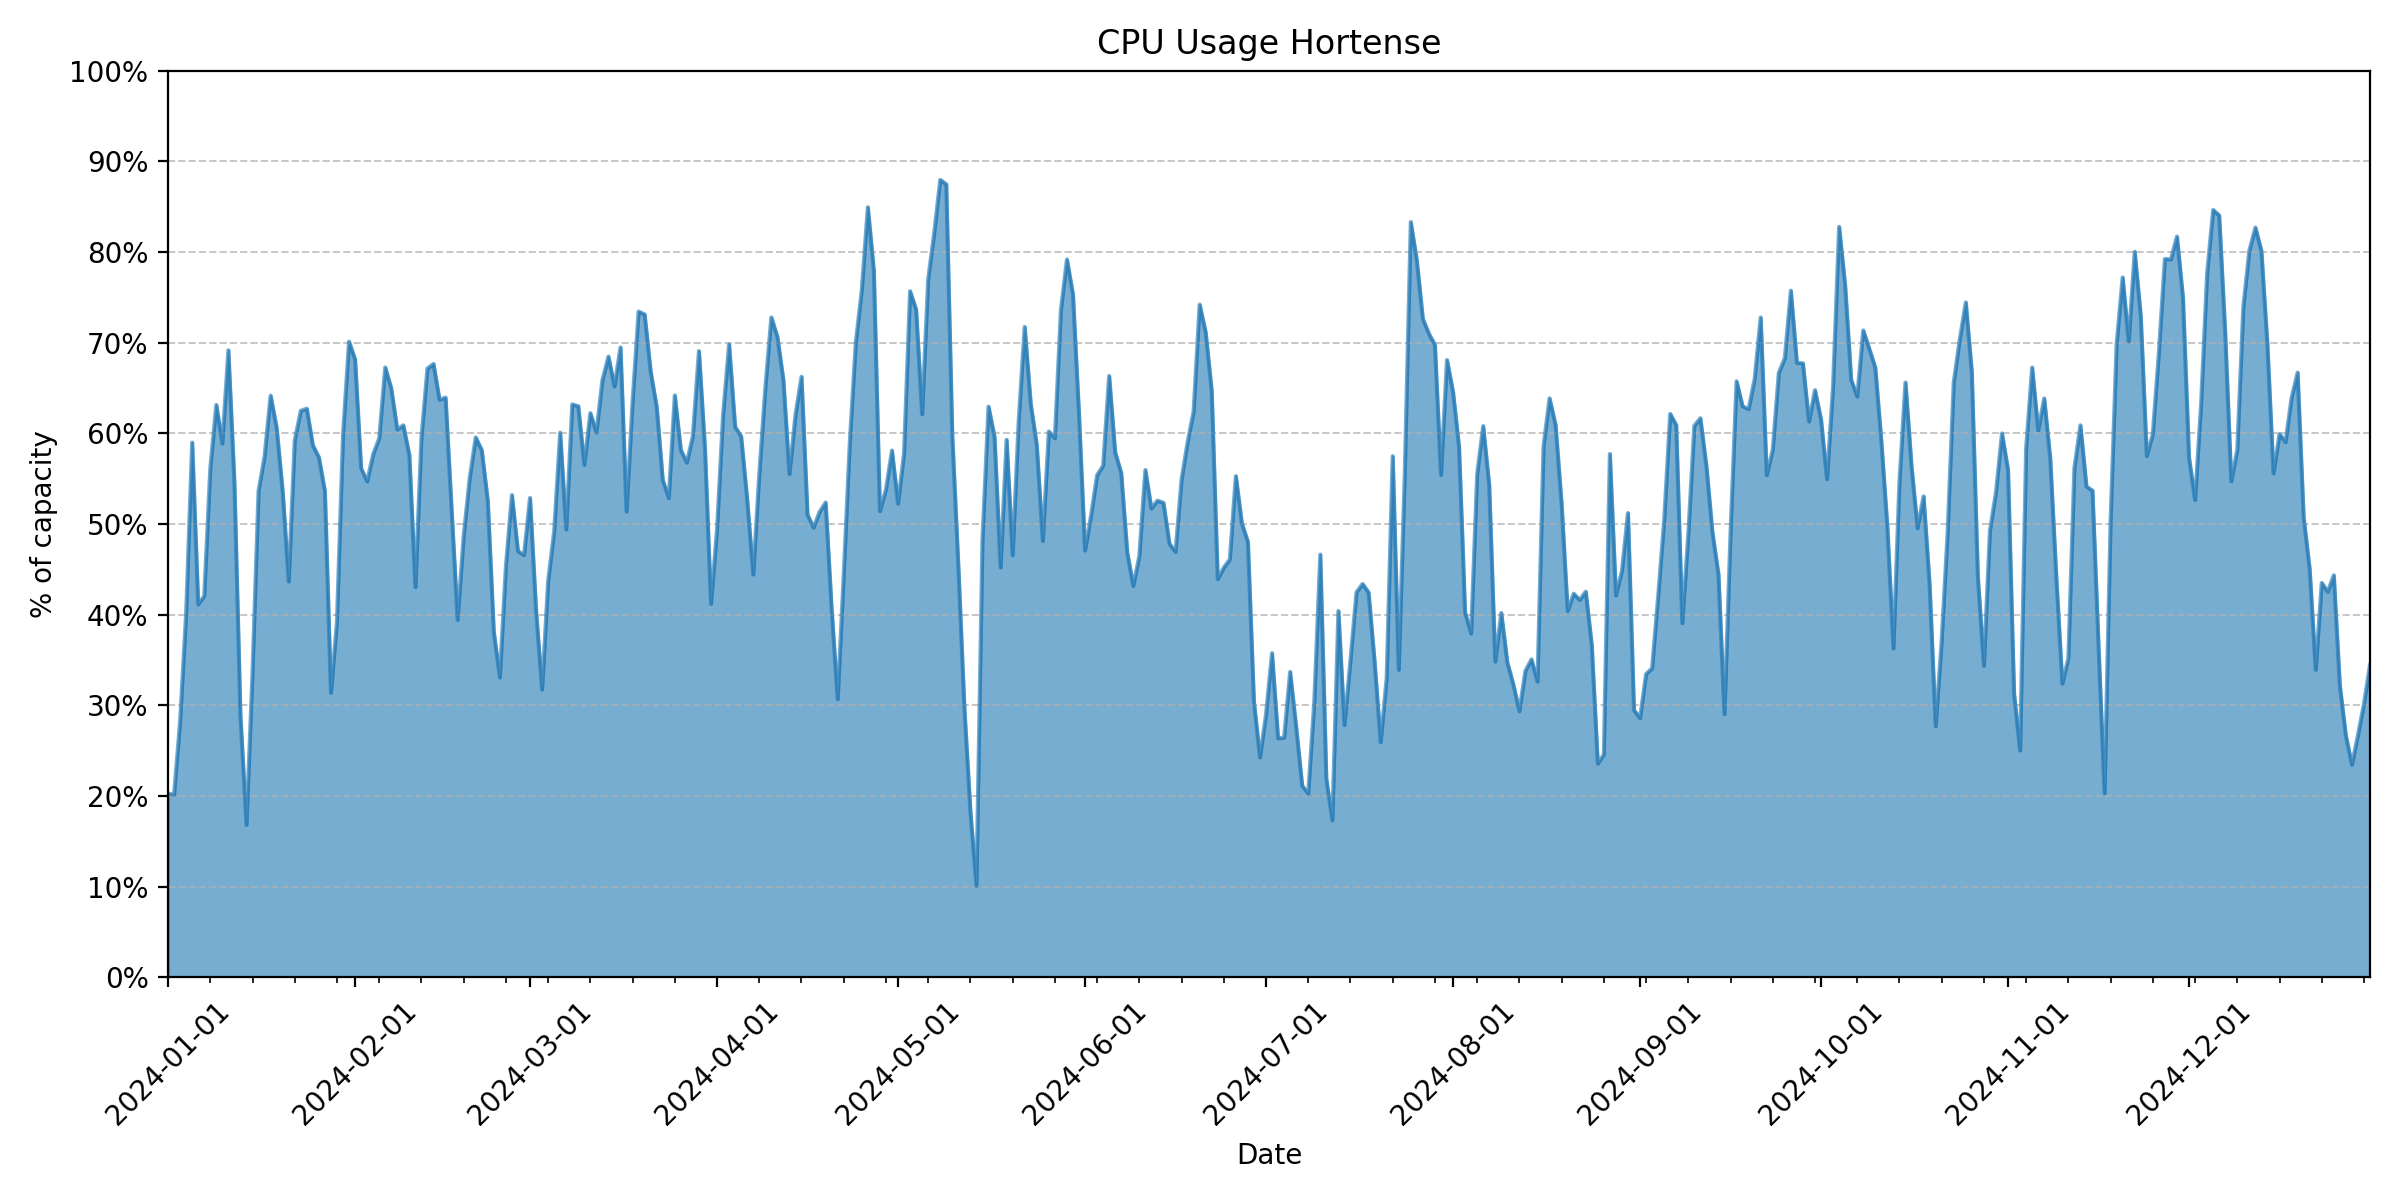
VUB researchers used about 9.9% of the CPU compute time of the academic usage of the Tier-1.
Usage of GPU Hortense in 2024:
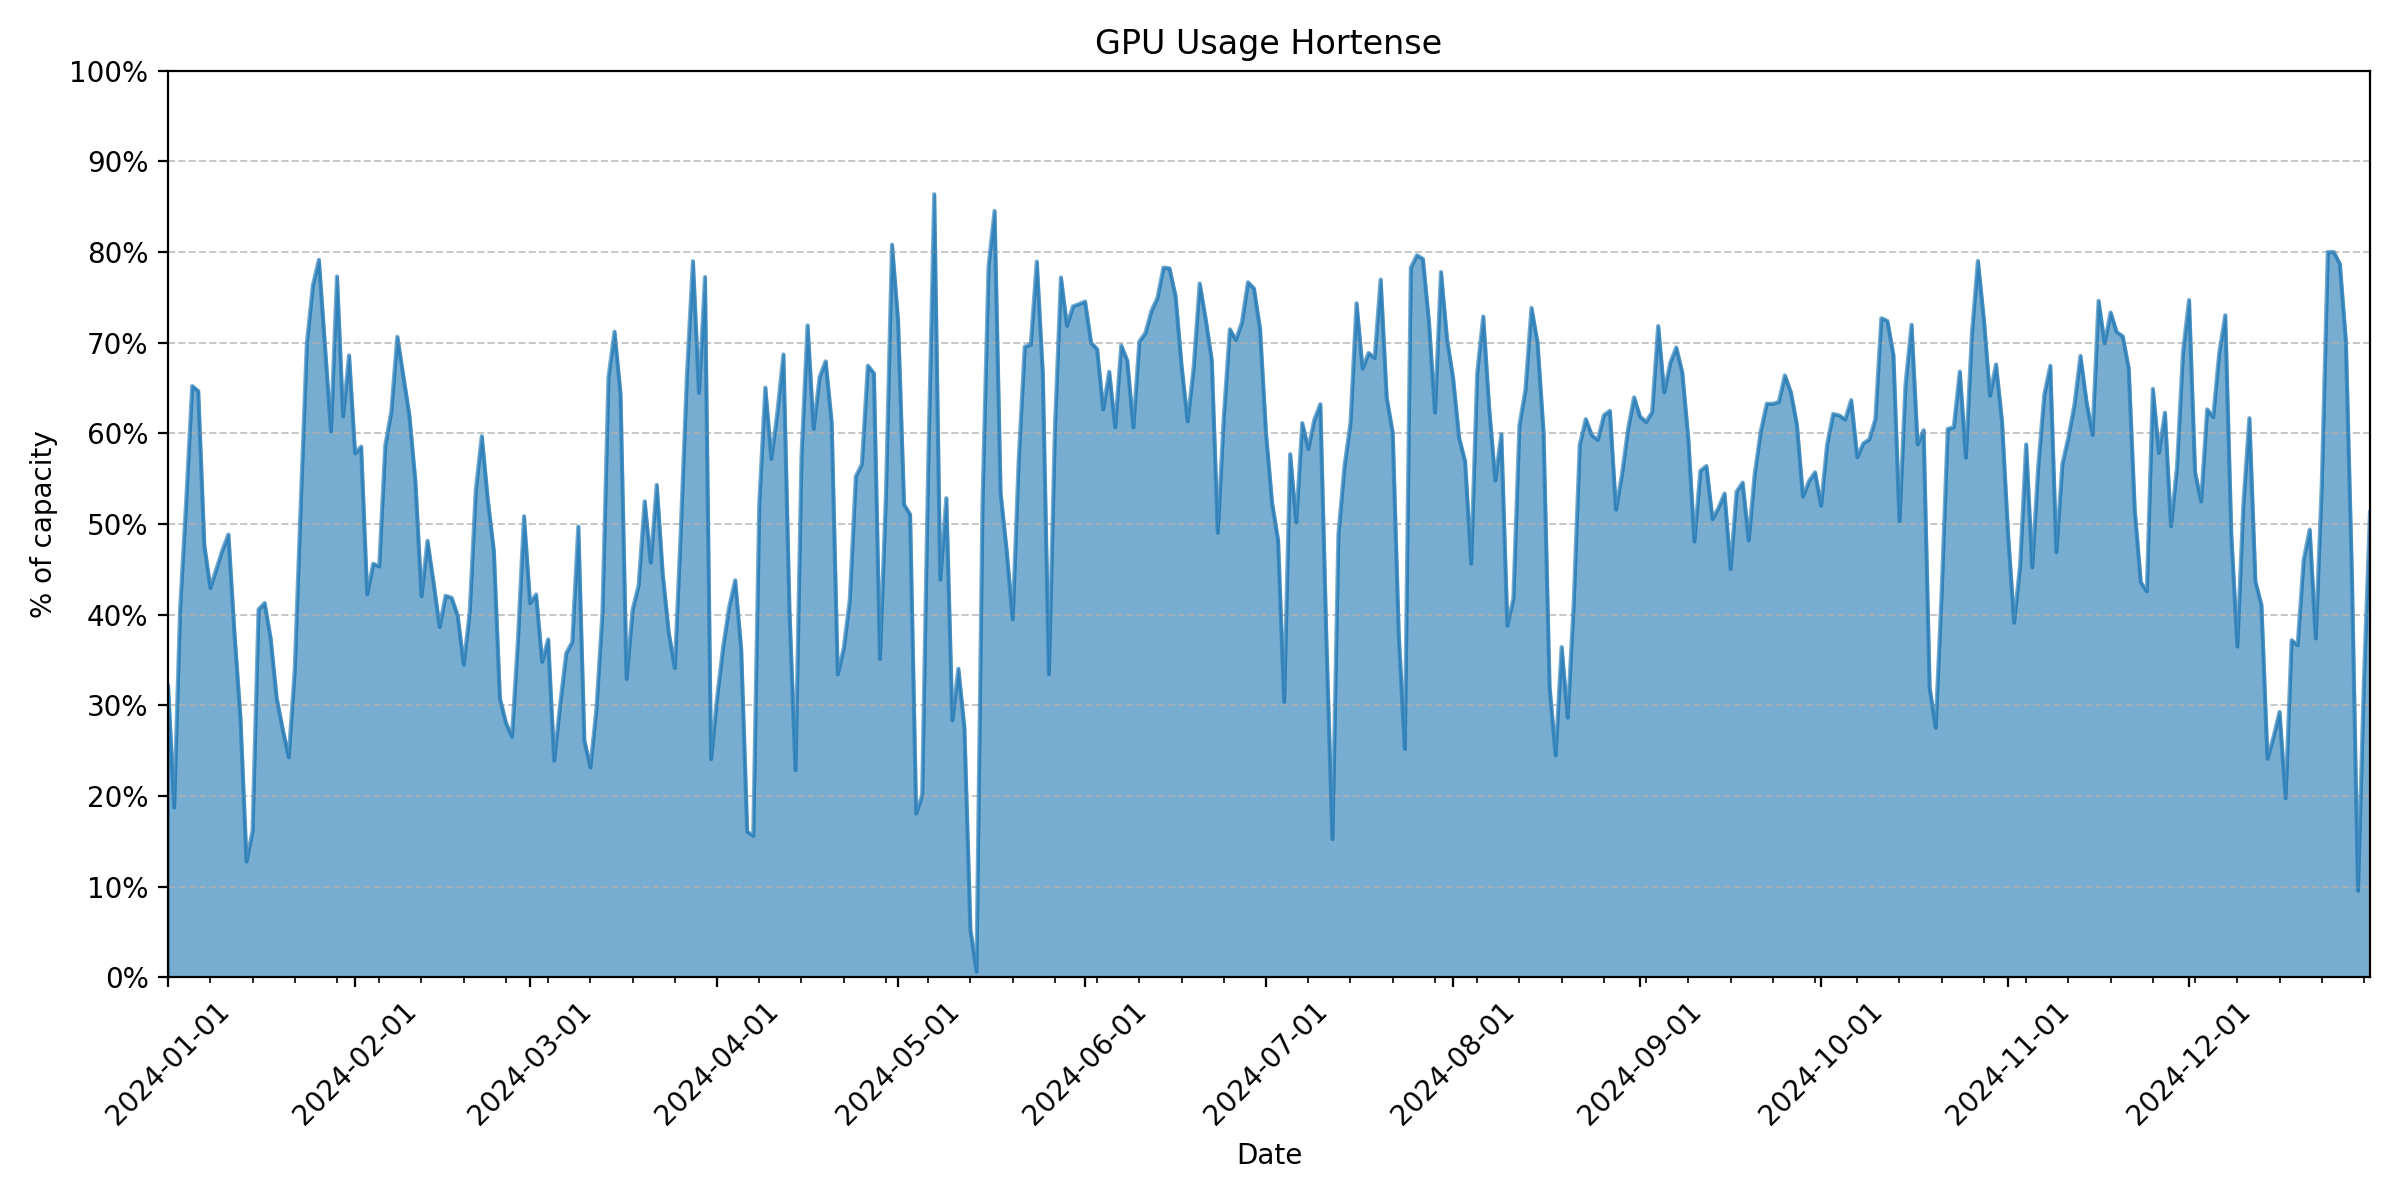
VUB researchers used about 6.2% of the GPU compute time of the academic usage of the Tier-1.
VSC User survey#
At the end of 2024 the second edition of the VSC-wide user survey was run. This survey encompasses all VSC services (all Tier-1 components and all Tier-2 systems).
See also
The results of the 2023 survey can be found on Overview of 2023
The invite for the survey was sent out on 5 November 2024 and the survey closed on 17 December 2024. In total 555 people responded and 411 of those completed the survey in full, which is a 10% increase compared to 2023. There were 54 people affiliated with the VUB among the respondents (much appreciated!).
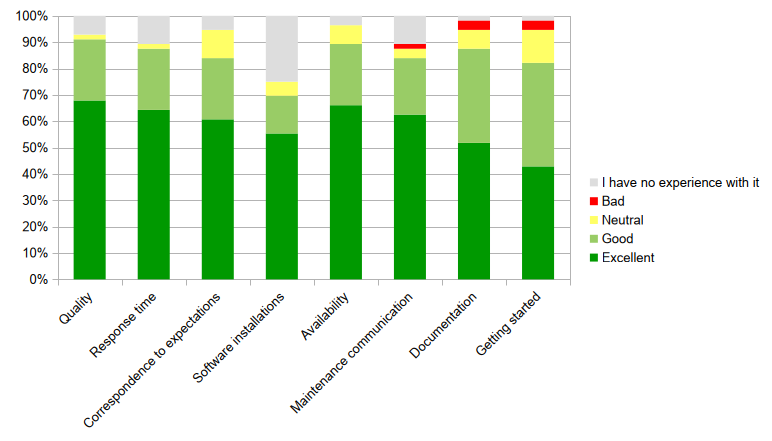
Looking at the answers of those respondents who said they were using VUB’s Tier-2 (Hydra), we get the following percentages of people who rated that service as Excellent or Good (discarding answers that said No Experience):
Quality |
98.1% (51/52) |
Response time |
98.0% (49/50) |
Correspondence to expectations |
88.7% (47/53) |
Software installations |
92.9% (39/42) |
Availability |
92.6% (50/54) |
Maintenance communication |
94.0% (47/50) |
Documentation |
89.1% (49/55) |
Getting started |
83.6% (46/55) |
In general we are happy with this result as it shows that our services are very positively valued by our users. Like last year, Getting started and our Documentation was rated as the least good point.
Regarding the documentation we started with a re-design in 2023 of the VSC docs website and in 2024 we continued with integrating our own documentation into it. The goal is to gather in a single place all the documentation related to our services.
Note
We are open to feedback on how we can improve the documentation. There is a constant effort in making the documentation both up to date and complete. So if you find anything wrong or have suggestions, please contact VUB-HPC Support
Getting started on Hydra is not easy as there is quite a learning curve. With training and documentation we try to lower the curve as much as possible. We hope that the new Open Ondemand portal will improve the situation. Our plan is that this portal will become the default way of accessing the cluster.
In the free comments section of the survey we found the following three main suggestions and requests:
More GPUs
Queuing time is perceived as too long
Add a Open OnDemand platform
We are aware that the GPUs are in high demand and the queuing time on them can be longer than tolerable at times. We are trying to actively push the biggest GPU users to the Tier-1 and we are working on buying more GPUs for Hydra.
Regarding Open OnDemand, this year 2025 we launched our new VUB portal based on Open OnDemand: New OnDemand web portal for HPC.
About advanced or application specific training, if you have any ideas on topics for such a training, please let us know at VUB-HPC Support.
Finally, we want to finish this report with several very positive comments that we spontaneously received in the survey:
“I am very impressed by how the HPC team listens to the users’ requirements. They were very quick to implement a test partition for GPU jobs which can enhances the workflow.”
“The user manual is very detailed and highly usable.”
“Sometimes the queue time is very long. However i want to emphasize that the HPC-team at the VUB are super helpfull. They are always nice and take their time to explain things to me.”
“They are always very friendly and helpful, very nice to work with them!”